Chronic Disease Research Group
Hennepin Healthcare Research Institute
701 Park Ave.
Suite S2.100
Minneapolis, MN 55415
Email: cdrg@cdrg.org
Tel: 612-873-6200
Mon-Fri: 8:00 AM - 4:30 PM CT
__________________________________________________________________________________
Nicholas Wood, PhD, Biostatistician
June 6, 2025
In early 2024, the Organ Procurement and Transplantation Network (OPTN) Expeditious Task Force announced its “bold goal of achieving 60,000 successful, lifesaving deceased donor transplants annually in the U.S. by the end of 2026,” which “represents a 58% increase in deceased donor transplants over the next three years.”1 Squarely halfway through that 3-year period, now is a fitting time to assess the Expeditious Task Force’s goal to see where things stand. We will do this using the Donation and Transplant System Explorer provided by the Scientific Registry of Transplant Recipients (SRTR).2,3 Using this tool, we can look at the yearly number of deceased donor transplants in the United States over the past decade.
![]()
Figure 1. Yearly counts of the number of deceased donor transplant recipient registrations forms (ie, deceased donor transplants). Source: https://www.srtr.org/tools/donation-and-transplant-system-explorer/2
Figure 1 is read as follows. From left to right we are moving forward in time from 2016 to the present (as of this writing, approximately May 20254). Each day the number of deceased donor transplants in the previous year is calculated and plotted in a blue line. For example, the value of the blue line on January 1, 2024, provides the number of deceased donor transplants in the year 2023—just shy of 40,000. Similarly, the value of the blue line on May 1, 2025, provides the number of deceased donor transplants between May 1, 2024, and May 1, 2025—just shy of 42,000.
In the first 17 months since the Expeditious Task Force announced its goal, the number of yearly deceased donor transplants increased by 2,000. To achieve the goal of 60,000, the number of yearly deceased donor transplants would need to increase by about 18,000 over the next 19 months. For context, this is approximately the same absolute growth that occurred over the past decade. In other words, at this point it is safe to conclude that the Expeditious Task Force will not achieve its goal.5
While it was a noble and admittedly “bold goal,” there are aspects of transplant volume that are out of the control of the Expeditious Task Force. To see this, consider the following. Recently, something has been happening in the United States that has not happened for the past 10 years—a rapid decrease in the number of drug overdose deaths6 (Figures 2 and 3; also Figure 1a from the National Vital Statistics System’s report on Provisional Drug Overdose Death Counts7).
This is undoubtedly a good thing, but what are its implications for transplantation? Historically, the third or fourth most prevalent mechanism of death in the deceased donor population has been drug intoxication. If the overall number of drug overdose deaths is decreasing in the United States, then we would expect the number of deceased donors resulting from those deaths to similarly decrease, and that is exactly what we see.

Figure 2. Yearly counts of deceased donors with a mechanism of death of drug intoxication.2

Figure 3. Yearly number of drug overdose deaths (blue) and number of donors resulting from drug intoxication (red). Sources: CDC data: https://www.cdc.gov/nchs/nvss/vsrr/drug-overdose-data.htm,7 accessed June 2, 2025; SRTR data: https://www.srtr.org/tools/donation-and-transplant-system-explorer/2
This is likely just one of myriad factors that influence the overall number of deceased donor transplants performed in the United States. The Expeditious Task Force cannot directly control transplant volume, so it would be hard to give them credit or blame regardless of whether their goal of 60,000 successful, lifesaving annual transplants by the end of 2026 is achieved. For that reason, it is my opinion that it was an unrealistic goal, not because 60,000 was unrealistically high, but because the target by which to judge the success of the Task Force was tied to something not directly under their control.
It must be acknowledged that the Task Force was also working on implementing and testing allocation variances to increase system efficiency and begin to address the current high rate of organ non-use. We are currently seeing 29% non-use of kidneys that are procured for the purpose of transplant. Addressing this non-use alone could result in up to 9,000 more deceased donor kidney transplants annually (Figure 4).

Figure 4. Annual number of deceased donor kidneys procured for transplant but not transplanted.2
Finally, more efficient organ offer processes might reduce transplant program burden in fielding organ offers that may never actually reach the program because the organ being offered is accepted earlier in the process. For example, we currently observe an average of over 10 programs notified of a deceased donor kidney when, in reality, the program never received a primary offer for one of their candidates (Figure 5). Implementing reasonable limits on how many programs should be notified based on the donor’s characteristics may reduce program burden in fielding organ offers and is more within the control of the Expeditious Task Force. Decreasing unnecessary offers reduces workload and likely increases the chance that a program would accept the offers they receive.

Figure 5. Annualized average number of excess programs notified of a deceased donor kidney offer. An excess program is defined as a program that received an offer for the kidney but was never made primary for any of its candidates.2
In conclusion, the Expeditious Task Force’s bold goal of 60,000 deceased donor transplants (successful, lifesaving, or otherwise) appears unattainable. We as a transplant community must continue to work together to identify ways to increase utilization of existing deceased donor organs and continue efforts to expand the deceased donor pool, until such time as we see deaths on the waiting list reduced to a minimum. The dedicated people in this field, including those on the Expeditious Task Force, can continue to identify ways to make this a reality.
References and Footnotes
Did you enjoy this post? Follow us for more!
__________________________________________________________________________________
May 1, 2025
In 2022, the Scientific Registry of Transplant Recipients (SRTR) hosted a consensus conference—sponsored by the Health Resources and Services Administration (HRSA)—that redefined what patient-centered care looks like in the organ transplant system. Instead of being sidelined, transplant recipients, living donors, and family members were fully integrated into every stage of the conference. They participated as speakers, moderators, and panelists, offering valuable lived experiences that influenced discussions on how to improve transplant metrics and outcomes. Through preconference training that reduced knowledge gaps, patients were prepared to contribute confidently and engage in high-level policy discussions. Their involvement sparked significant changes, such as ending the use of the term "discard" for unused donor organs—emphasizing how language shapes perception and practice in medicine.
By treating patients not as customers, but as co-investors in the health care system, the SRTR team created a new model for how medical conferences should be run. Patients’ voices were treated as equal to those of professionals, thus helping shape a more humane and data-informed approach to transplant care. Some key takeaways were the need for long-term outcome tracking, more patient-centered metrics beyond just mortality, and tools that promote shared decision-making between patients and providers. This conference set a new standard for health care conference best practices and demonstrated that real transformation in transplant care is possible when patients are not only heard, but also actively involved in driving change.
This AI-assisted summary is based on the following publication: Davis E Jr, Jones J, McCarthy M, McKee K, Reid M, Rogers D, Schmidt R, Tabatabai A, Hart A. The impact of engaging transplant recipients in health care policy deliberations. Prog Transplant. 2025 Mar;35(1):45-47. doi: 10.1177/15269248241304792.
Did you enjoy this post? Follow us for more!
__________________________________________________________________________________
Jonathan Miller, PhD, Biostatistician
February 9, 2024
In the previous post, introducing our work at the Scientific Registry of Transplant Recipients (SRTR) on the use of race in medical algorithms, we proposed that algorithms should be examined individually for whether or not to include adjustment for race. We offered the case of the kidney donor risk index (KDRI) as an example of an algorithm that should not include adjustment for race. In this post, we offer an example of an algorithm that we believe should include adjustment for race.
Case 2 – Include Race: CALC Donation Rates
The KDRI is an algorithm that tries to predict risk in the kidneys of an individual donor. Compare this to an algorithm that tries to identify high- and low-performing organ procurement organizations (OPOs). The thing being measured in an OPO evaluation algorithm is an organization—a group of people serving a population. While algorithms that measure individuals may be suspect because race is not biological, some of the social disparities experienced by some races may be very important to account for when the thing being measured is an organization.
Well-known historical examples like the Tuskegee Syphilis Study form a ground for reasonable mistrust of health care systems among minority racial groups in the United States. Organ donation is an act based on altruism and on trust. The example of the KDRI is one of many reasons that mistrust may continue. Labeling organs from Black donors systematically as “higher risk” can disrupt the trust that their organs will actually be transplanted if they choose to donate.
A current algorithm used to evaluate OPOs is the ratio of actual donors to potential donors.1 Potential donors, in this algorithm, are defined as deaths in the OPO’s service area that are cause of death, age, and location consistent with transplant (CALC deaths). A controversial question has been whether this ratio should be adjusted for race. One side has proposed that race should not be expected to affect an individual’s altruism in the decision to donate. We have proposed that while altruism is universal, trust in the health care system is very different across races and could cause very different average donation rates between races.
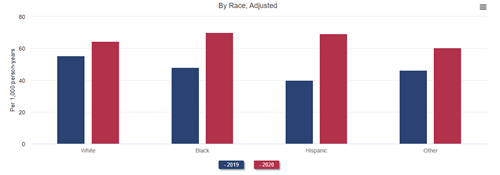
We studied whether to adjust for race in the OPO algorithm by calculating the ratio both with and without adjustment for race.2 We first found that there are differences in the national average rate of donation across races. While the ratio of actual donors to potential donors was 12.1% among White patients, the ratio was 10.0% among Black patients. If the OPO algorithm is not race adjusted, it means that in order to be in a high-performing tier, OPOs would need to perform better among Black potential donors than the national average among Black donors, but would not necessarily need to perform better among White potential donors than the national average among White donors.
In fact, when we compared tier ratings of OPOs between ratios that did and did not adjust for race, we found that eight OPOs would change evaluation tier. Particularly notable are two OPOs, which have 39.1% and 44.7% non-White potential donors, respectively. Both of these OPOs would change from tier 3 to tier 2 if the ratio were race adjusted and would therefore not be at risk of decertification without the chance to recompete for their service area. Actually, both of these OPOs also perform better than the national average among non-White donors. We interpret this to mean that even though these OPOs perform better than the national average among non-White potential donors, they are at risk for decertification because they have a high proportion of non-White donors, while an OPO that has a high proportion of White donors may not have to perform better than the national average among their donors to be recertified. Therefore, we believe the OPO ratios are an algorithm that should be adjusted for race.
Conclusions
There is no quick fix for bias in medical algorithms. It may be attractive to say we should never adjust for race in algorithms, but this can be just as risky as always including race. Each algorithm should be considered on its own. The algorithm should be tried with and without adjustment for race. If including race makes a difference in the outcome of the algorithm, we should consider why. When considering why race shows up statistically in algorithms, it is important to explore biological as well as social reasons. Race is not biological and shouldn’t be used as a proxy for biological measures in algorithms. But failing to explore biological explanations would mean ignoring explanations like the APOL1 gene, which could be used in other contexts to improve outcomes for Black kidney patients. Similarly, failing to explore social explanations could mean failing to recognize that some organizations are actually performing quite well among the patients they serve.
References
Did you enjoy this post? Follow us for more!
__________________________________________________________________________________
Jonathan Miller, PhD, Biostatistician
December 6, 2023
Algorithms have an important place in making public health and medical decisions. All algorithms require assumptions, and assumptions allow bias. Racial bias in modern statistics began as early as Francis Galton, a British polymath who began the eugenics movement in the 19th century. Galton thought it possible to measure culture and mathematically prove that Western European culture was superior to all other cultures.1 Many prominent statisticians who followed Galton also believed in Social Darwinism or Eugenics.2,3
Today, assumptions are being brought to light and tested. A well-known example of this is the equation for estimating patients’ kidney function. This equation originally included Black or African American race as one of the variables for estimating kidney function. The equation’s developers tried to explain the statistical relationship of Black race with kidney function with the erroneous assumption that Black patients had higher creatinine values because of having more muscle mass.4 This equation and assumption led to disparities, like Black patients having to have worse kidney function before they could start banking time on the kidney transplant waiting list than patients of other races. Uncovering the bias in the estimate of kidney function opened a wave of examinations of other equations used in transplant. The issue of including race in an equation has become contentious, and some say it should never be included in medical or public health equations.
In my work for the Scientific Registry of Transplant Recipients, we have carefully considered the inclusion of race in a number of equations. We use a framework proposed by the National Quality Forum, specifically:
When there is a conceptual relationship (i.e., logical rationale or theory) between sociodemographic factors and outcomes or processes of care and empirical evidence (e.g., statistical analysis) that sociodemographic factors affect an outcome or process of care reflected in a performance measure:
AND
This framework has led us to conclude that in some cases race should continue to be included in the algorithm and in some cases it should not. Over this and the next blog post, we will provide an example of each case.
Case 1 – Stop Including Race: The Kidney Donor Risk Index
The kidney donor risk index (KDRI) is an equation used to estimate the risk of graft failure from a particular kidney donor. The KDRI equation was modeled in 2009 and includes Black race as a predictor.6 KDRI is used in the policies that determine how potential deceased kidney donors are matched to recipients. The KDRI statistical model identified Black donors as having higher risk for graft failure. While the Black race predictor met the criteria of having an empirical relationship with graft failure, continuing to include it as a predictor also requires having an appropriate conceptual relationship. Race is social, not biological, which makes including race in equations for individual risk immediately suspect.
Our current best guess for why Black race statistically predicts kidney failure in donors or in patients is the higher probability of carrying a certain version of the APOL1 gene that protects against sleeping sickness.7 Genetic explanations have historically been misused or erroneous when used to explain racial differences, especially when trying to establish foolish ideas like universal superiority of fitness. Universal superiority of fitness could only exist if all environments were identical and never changed. Genes move in response to risks in specific environments, and a gene that protects from one risk might increase another risk. In the case of APOL1, there are versions of the gene that only occur in people with recent African ancestry that protected their carriers against dying from sleeping sickness. Unfortunately, if a person carries this version on both of their chromosomes, it also increases the risk of having kidney failure later in life.
So, we currently believe that statistical risk of kidney failure in Black donors is at least partly explained by a higher chance of carrying two higher risk APOL1 versions. The current best estimates are that about 13% of Black donors or patients may carry two higher risk APOL1 versions.7 Thus, a statistical model that uses an average risk for Black race would overestimate the risk of kidney failure in 87% of Black donors, and underestimate the risk in those 13% of donors who carry two higher risk APOL1 versions. It would be better to replace the Black race predictor with APOL1 risk as a predictor. But APOL1 versions are not data currently collected for kidney donors.
Given the lack of data to identify and measure APOL1 risk, decision-makers are left with the problem of whether it is better to possibly overestimate the risk of kidney failure in 87% of potential Black kidney donors or underestimate the risk of kidney failure in 13% of potential Black kidney donors.
There are about 140,000 candidates listed for kidney transplant and about 26,000 kidneys transplanted in a year.8 The percent of kidneys recovered from donors but not transplanted is now above 24%, and a higher KDRI increases the chance that the donor’s kidney will not be used.8 However, there are signs that getting a transplant, even with a higher KDRI kidney, is better than other treatments like dialysis.9 And with a higher chance of closer common ancestry, it may be easier for Black transplant candidates to find matches on genes like those of the human leukocyte antigens that reduce the risk of failure after transplant from Black donors. These considerations seem to give weight to removing the Black race predictor from KDRI, even if it may underestimate the risk of kidney failure in 13% of Black potential donors.
In fact, we modeled what would have happened if Black race had never been included in KDRI. We found that the percent of potential Black donors in the “highest risk” KDRI category (85th percentile and above) would drop from 28.7% to 17.7% and the percent of potential Black donors in the “lowest risk” KDRI category (20th percentile and below) would rise from 6.6% to 21.4% (Figure 1). This reclassification of kidneys from Black donors from “higher risk” to “lower risk” could decrease the chance that kidneys from Black donors are recovered but not used and could help reduce disparities in kidney transplant. Therefore, KDRI is an algorithm from which we would recommend removing the Black race predictor.
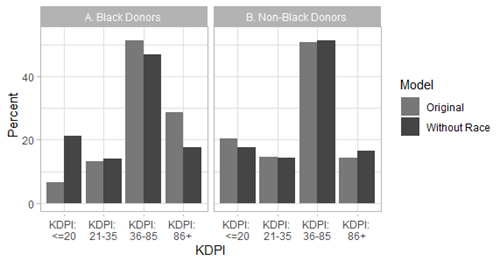
Figure 1: Percent of Black and non-Black donors by KDRI category with or without the race coefficient.
References
Did you enjoy this post? Follow us for more!
__________________________________________________________________________________
Cory Schaffhausen, PhD, Human Centered Design Engineer
October 2, 2023
Organ transplant is the best therapeutic option to improve quality of life and mortality for many patients with organ failure. Unfortunately, over 105,000 patients across the United States are now waiting for a kidney or liver transplant. Due to an extreme organ shortage, more than 10,000 patients die or become too sick for a transplant each year while on the waiting list. Despite numerous research interventions, rates of waitlisting and transplant have not increased in the United States in the past 2 decades. Organ procurement organizations (OPOs) are a primary driver of the deceased organ donation process and provide local service areas with education and family support (Figure 1). OPOs are a critical resource for disseminating interventions through local community relationships. However, OPOs face a barrier to continuously improve and scale interventions, because the national transplant system does not provide a feedback loop to identify effective interventions in individual communities.
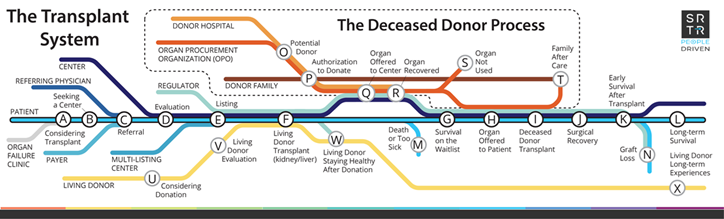
Figure 1: Schematic diagram of the organ transplant system and the role of organ procurement organizations in the deceased organ donation process (red line).
Racial disparities persist at each stage of the transplant process. Populations that are overrepresented in rates of organ failure are underrepresented in rates of organ transplant and organ donation.
A learning health system (LHS) approach offers a sustainable method to embed engagement and long-term monitoring into the transplant system. The Institute of Medicine defined LHS as “A system in which science, informatics, incentives, and culture are aligned for continuous improvement and innovation, with best practices seamlessly embedded in the care process, patients and families are active participants in all elements, and new knowledge is captured as an integral by-product of the care experience.” (Best Care at Lower Cost, 2012)
For the current organ donation system, new knowledge is captured for donation rates and waitlist and transplant outcomes; however, it is not fully put to use improving organ donation equity. An LHS system seeks to rapidly and continuously feed data into practice that is informed by stakeholder engagement (Figure 2). The organ donation process has the potential to benefit from the LHS model because OPOs collect wide-ranging organ donation data. These data are analyzed by the Scientific Registry of Transplant Recipients (SRTR), a federal government contract administered by the Chronic Disease Research Group (CDRG). SRTR analyzes and reports these data to monitor organ donation outcomes. Unfortunately, current analyses are insufficient to monitor equity in organ donation. This gap limits the ability to identify 1) long-term effectiveness of OPO-level interventions beyond the duration of research follow-up and 2) top-performing OPOs nationally to disseminate best practices for engaging underserved populations with low rates of organ donation.
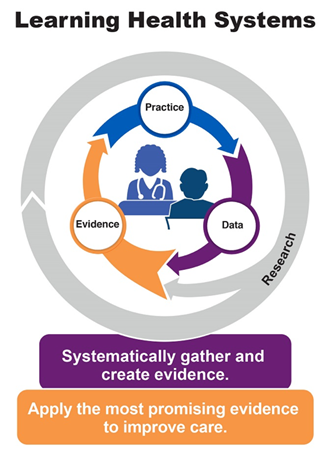
Figure 2: The Agency for Healthcare Research and Quality’s model for LHS.1
Researchers at CDRG were recently awarded a National Institutes of Health research grant to study methods to use national registry data from SRTR to develop equity-focused tools modeled after an LHS approach. The project is a collaboration with LifeSource, the OPO that serves Minnesota, South Dakota, North Dakota, and parts of Wisconsin. The grant will include many related goals, including 1) significant community outreach to develop tailored and culturally competent materials to improve community awareness of organ donation and 2) using SRTR and linked data, creation of organ donation data tools that will describe organ donation at county, race, and ethnicity levels to monitor disparities in organ donation. The development of data tools will include broad stakeholder engagement from OPO professionals and transplant professionals, as well as community groups. While the work has only recently begun, the 5-year grant will explore how to support OPOs as an LHS using data such as:
• disaggregated race and ethnicity data;
• county-level population demographic information and expected donation rates for race and ethnicity groups;
• county-level estimated donor registration rates for race and ethnicity groups;
• organ donation time trends for populations experiencing health disparities; and
• living donation disaggregated data by race and ethnicity.
The data can be a resource for OPOs and the public to understand organ donation equity, which is critical for informing community engagement and potential interventions to improve organ donation outcomes and equity.
References
1. From About Learning Health Systems. Content last reviewed May 2019. Agency for Healthcare Research and Quality, Rockville, MD. https://www.ahrq.gov/learning-health-systems/about.html
Did you enjoy this post? Follow us for more!
__________________________________________________________________________________
Grace Lyden, PhD, Biostatistician
April 24, 2023
In the United States, there are simply not enough deceased donor organs to transplant into every patient with end-stage organ failure at the time of diagnosis. Instead, each patient must join a national waiting list for the organ they need and wait to receive an offer of a suitable organ for them. So, an important question to answer for patients and their care teams is “How long does it take to get a transplant?”
The waiting time to receive a suitable organ offer depends on many factors. Some patients are easier to match, for example, based on their blood type and other immunologic sensitivities. Depending on the organ, allocation policy might prioritize patients who have been on the waiting list for longer, patients who are more in need of transplant, or patients more likely to benefit from transplant. That is, a patient might have to wait until they are “sick enough” to receive an offer, but not “too sick.”
Other patients, who might have waited longer or need the organ more, also need to be considered. So, a particular patient’s waiting time depends on not only that particular patient’s need, but also who else is on the waiting list at the same time, how long they have waited, and how sick they are.
All of these factors make estimating the waiting time for transplant a difficult problem. At the same time, it is one of the most important statistical problems in transplantation. This information helps patients and care teams decide whether to pursue alternatives to deceased donor transplant, like living donor transplant (for kidney and liver) or ventricular assist devices (for heart). Policymakers also need waiting time estimates to understand the impact of policy changes and evaluate equity in transplantation.
As a transplant statistician, I think about waiting time a lot. And when I am working with members of the transplant community who want to know about waiting time, my first step is to identify what they are really asking. It is not enough to say, “How long does it take to get a transplant?” There are at least three underlying questions someone might be asking when they say this, which have different answers that are estimated by different statistical methods.
The first underlying question someone might be asking is How long do transplant recipients wait for transplant? This can be important—for example, when we want to understand how the transplant recipient population is changing over time. It’s also very easy to answer. You simply look at all of the people who received a transplant during a particular time frame and calculate how long they waited. Figure 1 shows median waiting time among adult heart recipients who listed in 2010-2022. A “median” means that 50% of recipients had a waiting time less than or equal to that number.
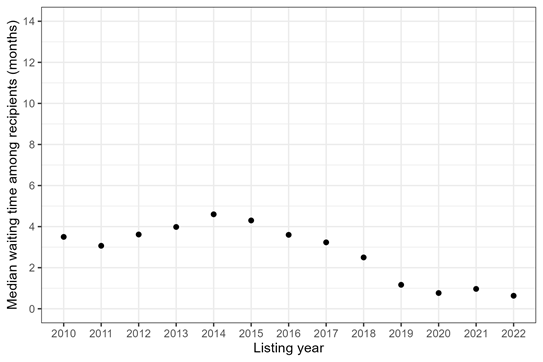
Figure 1: Median waiting time for heart transplant among adult recipients, by listing year.
The problem with this approach is that it ignores all of the patients who were on the waiting list and did not make it to transplant. Some patients die while waiting for heart transplant; others are removed because their condition deteriorates (or improves) and they are no longer a good candidate for transplant. In other words, there are “competing events” that can occur, which prevent a patient from making it to transplant. When a patient is on the waiting list (or about to register) and wondering how long they will wait, it is important to acknowledge that these competing risks exist.
So, the second underlying question someone might be asking is How long does it take for a patient to get a transplant, given that they might die or be removed from the waiting list before transplant?
To answer this second question, we typically focus on the percentage of patients who underwent transplant after some amount of time, compared with the percentage who 1) were still waiting at that time, 2) died or were removed from the waiting list because they were too sick for transplant, or 3) were removed from the waiting list for other reasons. In statistics, these percentages are called “cumulative incidences.”
When the cumulative incidence of transplant is 50%, for example, half of all candidates have undergone transplant. This is another “median waiting time.” Figure 2 shows this median waiting time among adult heart candidates listed in 2010-2022.
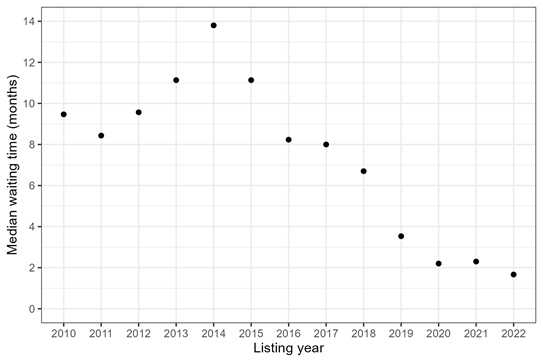
Figure 2: Median waiting time for heart transplant among adult candidates, by listing year. The median waiting time is when 50% of candidates have received transplant, while the other 50% are still waiting or have experienced a competing event such as death.
Both Figures 1 and 2 show that the median waiting time for adult heart transplant started to decrease in 2018, with the introduction of a new heart allocation policy that October. But especially pre-2018, the median waiting times for heart candidates that account for competing risks (Figure 2) were much longer than the median waiting times among heart recipients (Figure 1). For example, in 2014, the median waiting time for transplant recipients was 4 months, while the median waiting time for transplant candidates was 14 months. Those are two very different answers to the question “How long did it take to get a heart transplant in 2014?”
Zooming in on 2022, we can explore the cumulative incidence of each possible outcome by the median waiting time, which was 50 days after listing in 2022 (Figure 3). So, 50% of patients listed in 2022 had received a heart transplant after 50 days, while 3% of patients had died or been removed due to being too sick for transplant, 2% of patients had been removed for other reasons, and 45% were still waiting. 50% + 45% + 3% + 2% = 100%, representing all possible waitlist outcomes.
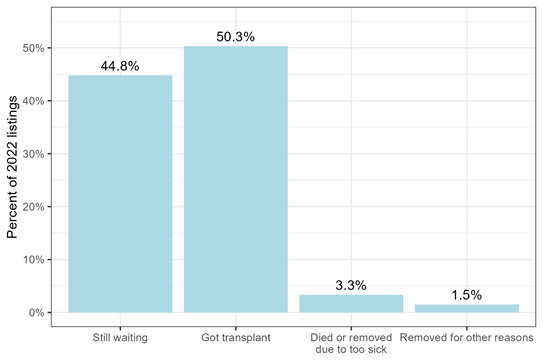
Figure 3: Waitlist outcome after 50 days waiting, for adults listed for heart transplant in 2022.
From the perspective of a patient who is still waiting, cumulative incidences (Figures 2-3) are less misleading than transplant waiting times among those who have undergone transplant (Figure 1) and also more actionable. For example, if a kidney transplant candidate has a high probability of dying before receiving a deceased donor transplant, they should be counseled to pursue living donation.
Cumulative incidences can help patients and clinicians understand the real-world probability of transplant and risk of death before transplant. Sometimes, however, we actually want to know the hypothetical waiting time for transplant if a patient could not die and stayed on the waiting list until transplant.
So, the third underlying question someone might be asking is How long would it take for a patient to get a transplant in a world without death?
In statistics, this is called a counterfactual, because it represents a world that does not, in fact, exist. Schools of thought differ about how useful this measure is for clinical decision-making, because it does not represent the “real world.” At the same time, it might be of interest to clinicians who want to know a patient’s underlying allocation priority, isolated from their risk of death, and it allows us to compare transplant access across patients with different underlying risks of death.
This third question is the most difficult for statisticians to answer, because we do not collect data from a hypothetical world without death. We collect data in the real world. And for patients who die before transplant, we simply do not know how long they would have waited for transplant had they lived.
Several statistical methods have been created to deal with this issue. For example, a method called “inverse probability weighting” accounts for the fact that patients who died before transplant might have been sicker than patients who did not die before transplant, and up-weights the patients who lived so they represent both themselves and the patients who died.
Figure 4 applies inverse probability weighting to compute the hypothetical median waiting time for a heart transplant, in a world without death or waitlist removal before transplant, for adults listed in 2010-2022.
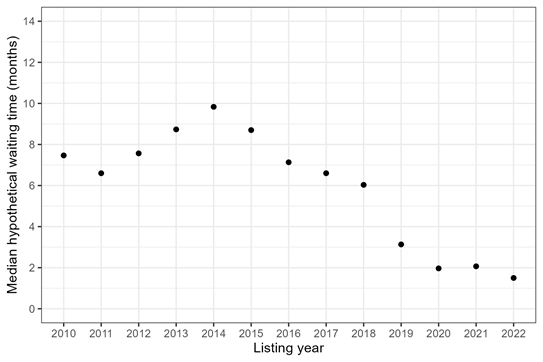
Figure 4: Median hypothetical waiting time for heart transplant among adult candidates, by listing year. The median hypothetical waiting time is when 50% of candidates would have received a heart transplant in a world without death or waitlist removal before transplant.
In a hypothetical world without death, the median waiting times for transplant are shorter than in the real world (Figure 2), which makes sense. But, the hypothetical waiting times are still longer than real-world waiting times among transplant recipients (Figure 1). Is this surprising? Maybe. We might guess that the hypothetical waiting times would be similar to real-world recipient waiting times, because both are for people who have avoided the competing risk of death. But this is not the case. Restricting to transplant recipients (and ignoring everyone else who was waiting) still underestimates the waiting time for transplant, even in a hypothetical world without death.
In summary, there are at least three underlying questions that a person might be asking when they say, “How long does it take to get a transplant?” They might want to know 1) how long transplant recipients wait, 2) how long transplant candidates wait, given that they might die before transplant, or 3) how long transplant candidates would wait, if they could not die.
It is important to be precise when formulating any research question. The goal of the research, the target audience, and which decisions we hope to inform must all be considered. We can find meaningful answers to difficult problems, but only when we ask a meaningful question.
__________________________________________________________________________________
Nicholas Wood, PhD, Biostatistician
February 1, 2023
Creating public policy to achieve a desired end is not as easy as you might think. This is especially the case when considering something as complex as allocation policy for organ transplantation. Because there are far more patients awaiting transplant than there are donated organs, allocation policy is written that determines which patients get priority when a donated organ becomes available. Each organ has its own allocation policy. Here we shall discuss a recent change to liver allocation policy intended to reduce geographic disparity in access to liver transplants.
Liver allocation policy has historically prioritized patients primarily using medical urgency and geography. A patient’s medical urgency is quantified by the model for end-stage liver disease (MELD) score, which ranges from 6 to 40. Higher MELD scores correspond to greater medical urgency, and therefore greater priority is given to patients with higher MELD scores. However, this prioritization is not absolute—geography also plays a key role.
Once recovered, a donated liver has a limited time frame to be transplanted. Furthermore, within that time frame it is generally preferable to transplant the liver sooner rather than later. Therefore, greater priority is given to patients whose transplant center is closer to the donor. For many years this was done via the donation service area (DSA).

Figure 1. Donation service areas
Just as the United States can be divided into 50 states, it can be divided into 57 DSAs. (Note: The number of DSAs changes from time to time but was 57 at the time of this writing.) DSA boundaries are interesting to say the least, however, it is outside of our scope to discuss how they came to be. All we need to know is that liver allocation policy has historically balanced medical urgency and geography by first prioritizing patients at transplant centers in the same DSA as the donor, and then, within that DSA, prioritizing patients with the highest MELD score.1
Over time, the transplantation community noticed that a patient’s access to transplant depended largely on which DSA his transplant center was in. We can show this by determining the median MELD at transplant for each DSA.
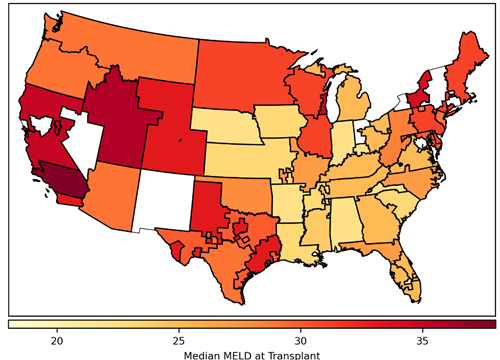
Figure 2. Median model for end-stage liver disease (MELD) score at transplant by donation service area. Includes deceased donor liver transplants occurring in 2014, excluding recipients who do not have a MELD score (ie, recipients younger than 12 years and status 1A/1B recipients). Donation service areas shaded white had no liver transplants during this time.
Median MELD at transplant can be interpreted as how sick a patient has to become to get a liver transplant. In 2014, the median MELD at transplant for recipients in the Alabama DSA was 22, whereas in one of the California DSAs it was 38. In other words, if you needed to get a liver transplant and were listed in California, you would need to be much sicker than if you were listed in Alabama. By calculating the variance in median MELD at transplant across all of the DSAs, we get a measure of geographic disparity. In 2014, the variance in median MELD at transplant was 20. While it’s difficult to interpret this measure of geographic disparity, it suffices to say that higher variance corresponds to greater geographic disparity. Therefore, the transplantation community set out to design a new allocation policy that would reduce geographic disparity by reducing the variance in median MELD at transplant.
The new allocation policy that came out of this lengthy endeavor, the acuity circles policy, was implemented in early 2020. The acuity circles policy replaced the DSA as the geographic unit of allocation by using three concentric circles around the donor hospital. These circles were 150, 250, and 500 nautical miles in radius.
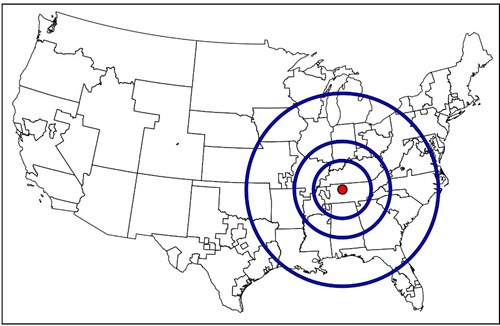
Figure 3. Acuity circles shown around an example donor hospital in Tennessee.
Acuity circles balances medical urgency and geography by first prioritizing patients with the highest MELD scores of 37 to 40, and then, within that range of MELD scores, prioritizing candidates first within the 150–nautical-mile circle, then the 250–nautical-mile circle, and then the 500–nautical-mile circle. This is then repeated for the lower MELD scores as well.2 Simply based on how much larger the circles are relative to the DSAs, intuition suggests that the acuity circles policy should reduce geographic disparity. There were also simulation studies performed by the Scientific Registry of Transplant Recipients that agreed with this intuition.
Acuity circles has now been in effect for three years and we can ask whether it achieved the desired goal of reducing geographic disparity. In the year preceding its implementation, the variance in median MELD at transplant was about 12; in the year after its implementation, the variance in median MELD at transplant was slightly lower, at about 11. Take a moment and look at these numbers again. Do you notice anything strange? In the years immediately surrounding implementation of the acuity circles policy, the variance in median MELD at transplant was between 11 and 12, but in 2014 it was nearly twice as high—at 20. So what happened?
It’s helpful to look at how variance in median MELD at transplant has changed over time to see the bigger picture. On each day from 2010 through 2022, we can calculate the variance in median MELD at transplant in the previous year.
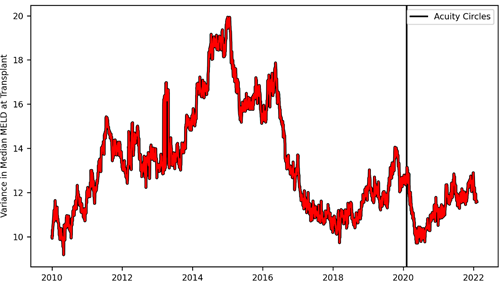
Figure 4. Variance in median model for end-stage liver disease (MELD) at transplant over time. On each day, variance in median MELD at transplant was calculated based on deceased donor liver transplants in the previous year, excluding recipients who do not have a MELD score (ie, recipients younger than 12 years and status 1A/1B recipients). The vertical line indicates the date the acuity circles policy was implemented.
After acuity circles was implemented we can see the variance in median MELD at transplant quickly drop and then shortly thereafter rebound to roughly where it was prior to the policy change. At best, acuity circles minimally decreased geographic disparity and, at worst, it had no lasting impact on it at all. However, from approximately 2014 to 2018, the variance in median MELD at transplant plummeted from 20 to 10. What happened that caused geographic disparity to be cut in half? Unfortunately, I do not know. But what I do know is that it happened naturally, on its own, without the need for any committee, governing body, or policy to bring it about.3
I’d like to propose three lessons we can draw from this for policy-making in organ transplantation. First, anyone who participates in creating such policy (myself included) should approach the task with humility. For something as complex as organ allocation, with its many moving parts, it will never be entirely clear beforehand whether a proposed policy will achieve its desired end, even when everything seems to suggest it will. Second, the assumptions that underlie allocation simulations must be well understood and clearly explained, such that their results can be accurately interpreted. Otherwise, simulation results will mislead us instead of guide us.4 Finally, when confronting some problem in transplantation (eg, geographic disparity), perhaps it is worth asking whether policy is really what is needed to solve it.
Footnotes
__________________________________________________________________________________
Kirsten Johansen, MD, CDRG Co-Director
December 19, 2022
The United States Renal Data System 2022 Annual Data Report (ADR) was posted on October 31, 2022. This year’s report contains data from medical claims through 2020 (and for some end-stage renal disease [ESRD]–related metrics through the first half of 2021). As such, this is the first year in which the wide-ranging effects of the COVID-19 pandemic on the chronic kidney disease (CKD) and ESRD populations can be placed into the full context of the years that preceded its onset. Although we presented early views into the impact of the COVID-19 pandemic on the ESRD population in the 2020 ADR and expanded these analyses to include examination of COVID-19 diagnoses and outcomes in the CKD population in the 2021 ADR, the full magnitude of the direct and indirect effects of the pandemic on these populations comes into sharp focus throughout this year’s report.
The direct effects of COVID-19 can be measured by examining patterns of patient testing, hospitalization, and mortality. Over 10% of patients with CKD, 13% of patients with a kidney transplant, and 20% of patients on dialysis in January 2020 were diagnosed with COVID-19 by the end of June 2021, rates that were approximately 50%, 100%, and 200% higher than that of Medicare beneficiaries without CKD, without a kidney transplant, and not on dialysis, respectively.
Cumulative incidence of diagnosed COVID-19 among Medicare beneficiaries by CKD and ESRD status, January 2020 - June 2021
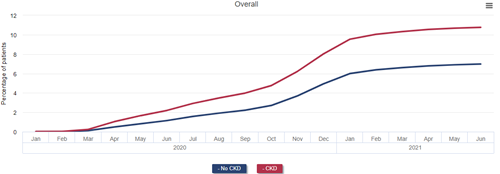
Data Source: 2022 United States Renal Data System Annual Data Report
The incidence of hospitalization after COVID-19 diagnosis among patients with CKD was more than double that of those without CKD in 2020; patients receiving dialysis consistently had hospitalization rates higher still than those with earlier stages of CKD.
Monthly incidence of COVID-19 hospitalization among Medicare beneficiaries by CKD and ESRD status, January 2020 - June 2021
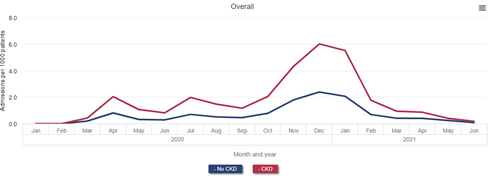
Data Source: 2022 United States Renal Data System Annual Data Report
Mortality at 14, 30, and 90 days after diagnosis of COVID-19 was more than twice as high among beneficiaries with CKD as among those without. Nearly one-quarter of patients with CKD who were diagnosed with COVID-19 died within 90 days. Mortality after COVID-19 diagnosis was even higher for patients with ESRD, reaching 40.5% for patients on dialysis and 44.1% among kidney transplant recipients 90 days after diagnosis.
All-cause mortality after COVID-19 diagnosis in Medicare beneficiaries by CKD and ESRD status, January 2020 - June 2021
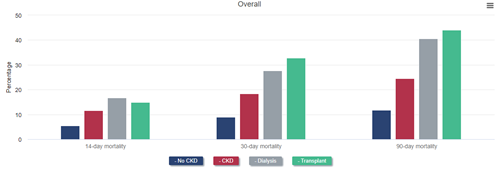
Data Source: 2022 United States Renal Data System Annual Data Report
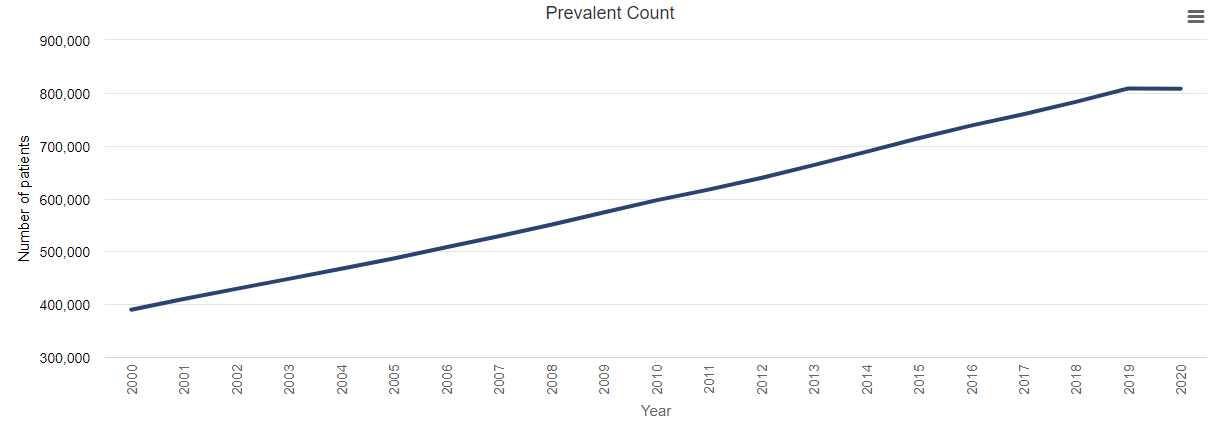
The ultimate result of the higher incidence of COVID-19 and higher mortality after diagnosis of COVID-19 among patients with CKD (including ESRD) was the unprecedented shrinking of the prevalence of diagnosed CKD and ESRD in 2020. As a result of fewer patients reaching diagnosed ESRD and the increase in mortality rate among patients with ESRD attributable to the pandemic and its effects, the rate of prevalent ESRD decreased by almost 2% in 2020.
Prevalence of ESRD, 2000-2020
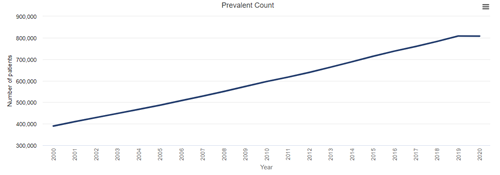
Data Source: 2022 United States Renal Data System Annual Data Report
Mortality after COVID-19 was higher among Black and Hispanic Medicare beneficiaries with CKD than among White beneficiaries with CKD. As a direct result of this higher COVID-19–related mortality and, possibly, more limited access to medical care unrelated to COVID-19, mortality increased more among Black than among White beneficiaries with stage 4 or 5 CKD in 2020. This resulted in a reversal of the longstanding observation of lower mortality among Black patients with CKD. In other words, whereas Black beneficiaries with CKD had lower mortality than White ones with CKD in 2019 and prior years, they had higher mortality than their White counterparts in 2020. A similar reversal of the Black-White mortality difference occurred in transplant recipients: mortality was higher among White recipients in 2019 but among Black recipients in 2020. The mortality difference did not reverse among patients treated with dialysis, but it did narrow, from 43% higher mortality among White patients in 2019 to only 30% higher mortality in 2020.
All-cause mortality rate in older adults, by CKD stage and demographics, 2019 and 2020
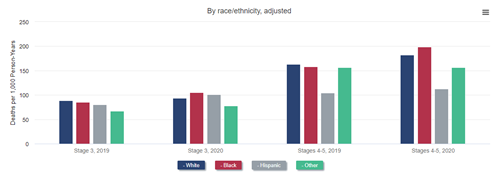
Data Source: 2022 United States Renal Data System Annual Data Report
All-cause mortality in adult ESRD patients, by demographics and treatment modality, 2019 and 2020
Data Source: 2022 United States Renal Data System Annual Data Report
Other direct and indirect effects of COVID-19 and the changes in availability and delivery of health care that occurred in 2020 can be seen throughout the ADR and in many metrics typically tracked in the CKD population, including the ESRD population. Some particularly alarming developments among patients with ESRD follow:
The United States Renal Data System will continue to monitor these trends going forward to determine whether they rebound to prepandemic levels or continue to be worse than prior to 2020.
__________________________________________________________________________________
Cory Schaffhausen, PhD, Human Centered Design Engineer
Jon Snyder, PhD, Director, Scientific Registry of Transplant Recipients
October 6, 2022
Monitoring the organ transplantation system
The organ transplantation system in the United States is often considered a model for rigorous monitoring of health outcomes in a medical system. The Scientific Registry of Transplant Recipients (SRTR) is a national registry of data on organ transplant candidates, recipients, and donors housed within the Chronic Disease Research Group (CDRG) of the Hennepin Healthcare Research Institute (HHRI). SRTR plays a key role in monitoring the performance of the transplantation system, including the transplant programs and organ procurement organizations. SRTR analyzes and publicly publishes data on organ transplants on the SRTR website. Historically, these data reports have been technical and primarily used by professionals and regulators.
In recent years, SRTR has targeted several initiatives to provide information to patients that can be more readily understood, used to navigate the transplant journey, and inform key health care decisions. The human-centered design process used includes iterative steps to understand and address patient needs. SRTR has two parallel focus areas that combine to provide a roadmap for making the SRTR data registry a resource for patients. One focus area is patient, family, and donor engagement to better understand information that is important to these groups. The other focus area is the design of a website with improved navigation and data presentations to allow users to easily find and interpret the information that is important.
What information is important to patients, family members, and donors?
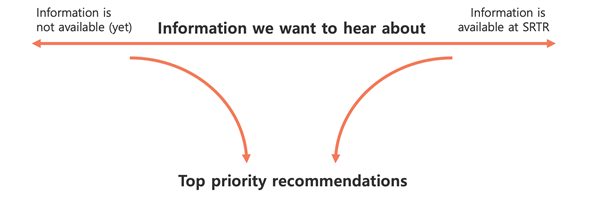
In July 2022, SRTR conducted the People Driven Transplant Metrics Consensus Conference. The conference was a multidisciplinary meeting that included patients, professionals, regulators, and other transplant stakeholders. Patient engagement for the meeting was an important step to work toward a better transplantation system and recognize that patients are at the core of the transplantation field. Patients were directly involved in the conference planning, and the meeting was informed by patient, family member, and donor feedback from a series of virtual feedback sessions and an online public comment forum.
The conference dedicated a series of discussions to identifying information that is of importance to patients, family members, caregivers, and donors. The scope of feedback was intentionally broad to include not only requests for information that can currently be met using existing SRTR data but also requests for information that may not currently be captured within the system. The discussions included a final step to identify the highest priorities. The feedback from all groups was compiled and synthesized into a comprehensive list to inform the development of future online resources.
How can patients, families, and donors easily navigate to find information they seek?
The patients who are seeking a transplant are a heterogeneous group, and the transplant journey is often a complex, multiyear process. The information that is important for a decision may be specific to the needs of each person, including their location, medical characteristics, and point along the transplant journey. The SRTR database includes an expansive scope of data that may be relevant. While the conference identified important information, it did not specifically address potential methods to help patients navigate and identify the information they are seeking.
In parallel to the conference, SRTR engaged with a professional design firm to begin work on a future website with patient needs factored in from the ground up. The process was iterative and based on continuous feedback to test and improve prototypes. The concept design phase included three cycles that began with seven potential website concepts and gradually converged into a preferred concept, with mockups of primary homepages and multiple patient resource pages and interactive data tools. Ongoing development will continue to integrate patient feedback into the design process.
SRTR looks forward to continuing this focus on the needs of consumers of our nation’s transplantation system, recognizing that the patients, their caregivers, living donors, and deceased donor family members are the consumers whom the entire system is designed to serve. The Agency for Healthcare Research and Quality (AHRQ) recognized the ongoing need to continue to improve health care report cards to improve information for patients, noting that “Finding ways to make public reports more relevant and useful to consumers is part of an overall strategy to improve health care.” In addition, a recent report by the National Academies of Sciences, Engineering, and Medicine made numerous recommendations to improve our nation’s transplantation system and noted “there is an opportunity to refocus the organ transplantation system around the patient experience of needing and seeking an organ transplant.”
To further this process of refocusing on the patient experience, SRTR welcomes more viewpoints. If you are a patient, caregiver, living donor, or deceased donor family member who would like to get involved, please email SRTR at SRTR@SRTR.org.
__________________________________________________________________________________
Nicholas Roetker, PhD, MS, Epidemiologist
April 1, 2022
Time-to-event analyses can provide useful information to clinicians and their patients for making informed medical decisions. Patients often ask physicians questions such as:
Physicians can respond by counseling patients about average (mean) times for various outcomes, but also commonly find it useful to speak in terms of cumulative incidence. Cumulative incidence, a measure commonly estimated using time-to-event analysis, describes the risk of an event (typically one adverse in nature) occurring before a specific time point. Given their intuitive appeal, cumulative incidence estimates are a cornerstone of United States Renal Data System (USRDS) analyses, appearing often as figures in the USRDS Annual Data Report.
As an example, patients with end-stage kidney disease (ESKD) requiring maintenance hemodialysis often use a graft or fistula for vascular access. Even though they are considered “permanent” accesses, fistulas and grafts usually require interventions to maintain their patency over time. Some accesses may fail entirely, requiring abandonment and placement of a completely new permanent access, which is an adverse event known as “loss of secondary patency.”
Upon first successful use of a graft or fistula as access for hemodialysis, patients or their health care providers may wonder what the chances are that the access will lose secondary patency (ie, require final abandonment) within the first 1 or 2 years of use. This type of question can be informed directly with a cumulative incidence analysis.
However, when estimating or interpreting cumulative incidence, it is important to consider the impact of competing risk events, which are events that a patient may experience that would prevent the occurrence of the adverse event under study. Death, in particular, is an important competing risk to consider in most time-to-event analyses involving populations with high rates of morbidity and mortality, such as the ESKD population. As one might imagine, this is a sensitive issue for physicians and other health care providers to discuss with patients, who may think answers to reasonable clinical questions are easy to provide. When patients wonder how long a fistula is likely to last, they may implicitly assume they will outlive the access; they may not fully consider the possibility that death could occur before the access is lost.
Whether or not death is accounted for as a competing risk in the analysis will lead to different interpretations of the resulting cumulative incidence estimate, with potentially important implications for counseling patients. Let us consider an example estimating the 2-year cumulative incidence of loss of secondary patency among patients initiating hemodialysis with a functioning fistula in 2016-2018. In the analysis explicitly accounting for death as a competing risk, we see that there is an estimated 3.4% risk of experiencing secondary patency loss, before dying, by 2 years after first use of the access.
Cumulative incidence of loss of secondary access patency after HD initiation with a fistula in 2016-2018, accounting for competing risks
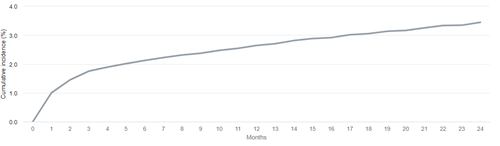
Data Source: 2021 United States Renal Data System Annual Data Report
Conversely, in the analysis that does not account for death as a competing risk, we see that corresponding 2-year risk of loss of secondary patency is estimated to be slightly higher (5.0%).
Cumulative incidence of loss of secondary access patency after HD initiation with a fistula in 2016-2018, not accounting for competing risks
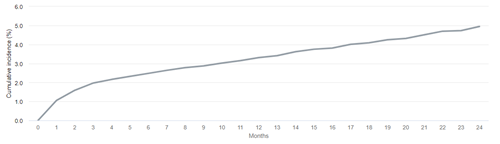
Data Source: 2021 United States Renal Data System Annual Data Report
In this analysis, death is treated as censoring in the same way as any other, more “conventional” censoring event (eg, administrative end of follow-up). Time-to-event analyses require making the assumption that the risk of experiencing the event of interest is the same, on average, for patients who remain in the study and patients who are censored, a concept known as noninformative censoring. However, assuming that patients who die share the same risk of going on to lose secondary patency as those who remain alive is, frankly, absurd—those who die can never experience any future event!
As such, for the analysis that does not treat death as a competing risk, one must interpret the cumulative incidence as the risk of secondary patency loss in a hypothetical world in which death can be prevented from occurring. In other words, we must assume that for the patients who died, had we only been able to prevent death and follow them forward for a longer time, we would have observed that they had the same underlying risk of patency loss as those who did not die. In general, the reasonableness of this assumption is going to depend on the specific clinical context of the time-to-event analysis.
Many epidemiologists would advocate for explicit accounting of competing risks when estimating cumulative incidence. This may be particularly true in a disease state such as ESKD, where patients face complications related to both their treatment choices and their general health. For a patient with a short predicted remaining lifespan, electing to receive an “inferior” vascular access (ie, a graft) may represent the best option if the placement of the access is less invasive and it will be ready for use in dialysis more quickly. In this scenario, providing cumulative incidence estimates that account for competing risks may provide the best information for weighing risks and benefits of different treatment options. Thus, in many situations, clinicians should learn to sensitively employ cumulative incidence calculations that incorporate the idea of competing risks—especially death—when speaking to patients about what the future might hold for their health.
__________________________________________________________________________________
Jonathan Miller, PhD, MPH, Biostatistician
February 1, 2022
In the December 15, 2021, Chronic Disease Research Group (CDRG) blog post, Dr. James Wetmore asked the following question and follow-up questions: “’What happened to all these patients with advanced CKD [chronic kidney disease] approaching the need for dialysis and kidney transplantation?’ Will there be a make-up ‘surge’ in incident dialysis patients in the future? Or, more ominously, did many people with stage 5 CKD die before they ever had a chance to initiate dialysis (or receive a kidney transplant), due either to COVID-19 or to non–COVID-19 causes that became more difficult to diagnose and treat as the pandemic stressed the US health care system?”
Dr. Wetmore was discussing United States Renal Data System (USRDS) data, but this question is also important for CDRG’s other registry contract, the Scientific Registry of Transplant Recipients (SRTR). Patients receiving dialysis are generally also candidates for, and future recipients of, kidney transplants. Additionally, there is concern that COVID-19 will have lasting impacts on patients at risk, or receiving other solid organ transplants such as heart, lung, liver, pancreas, kidney, intestine, and multiorgan (all of which SRTR currently monitors). Given the large overlap in the dialysis and kidney transplant candidate populations, SRTR has published about similar increases in mortality during the pandemic for kidney transplant candidates and shown that the number of candidates on the waiting list remains lowered.
A source for COVID-19 impact updates regarding transplant candidate and recipient populations is the SRTR COVID-19 app. Some trends shown on this app identify increases in both waitlist mortality and graft failure in the kidney candidate and recipient populations during the first 2 months of the pandemic, and during the winter 2020-2021 surge as well. (Figure 1)
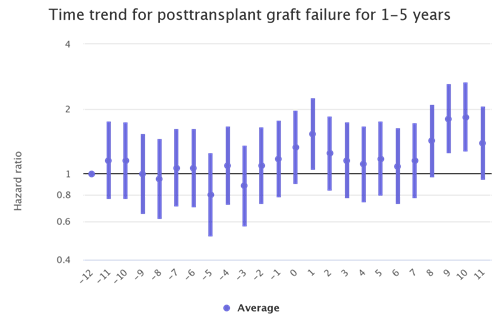
Figure 1: Month trends in kidney recipient graft failure
The kidney transplant populations show the most dramatic increases in waitlist mortality and graft failure during the waves of the pandemic. There are also increases during the waves among the liver and lung transplant populations although not as stark. (Figures 2 and 3)
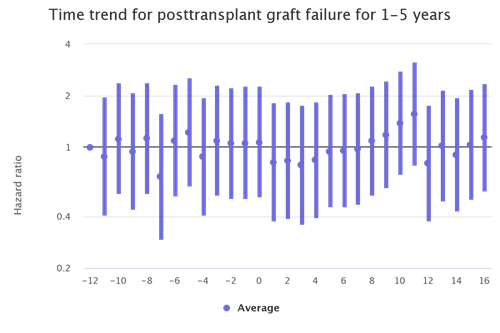
Figure 2: Month trends in lung recipient graft failure
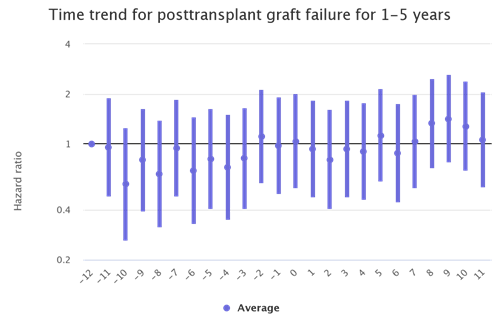
Figure 3: Month trends in liver recipient graft failure
As with the USRDS data, it is possible with SRTR data to identify deaths by transplant center for which COVID-19 is listed as the cause. By the winter 2020-2021 pandemic surge, there were clear surges in deaths attributable to COVID-19 among heart, lung, liver and kidney recipients. This alarming pattern reemerged during the Delta variant surge in fall 2021 despite vaccination being widely available. (Figure 4)
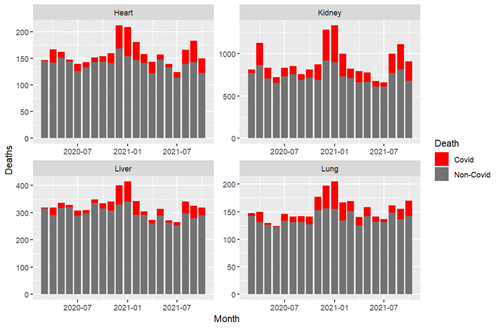
Figure 4: Deaths attributable to COVID-19 among transplant recipients
Much like with pretransplant and dialysis populations, there are continuing impacts of COVID-19 on transplant recipients. While we didn’t know in March 2020 that we would still be monitoring COVID-19’s impact on transplant recipients 2 years later, SRTR is continuing to track outcomes in this higher risk population.
For more information on SRTR’s COVID-19 research efforts, visit the SRTR website.
__________________________________________________________________________________
James Wetmore, MD, MS, Medical Director for Nephrology Research
December 15, 2021
Amazingly, an entire year has passed since the Chronic Disease Research Group (CDRG) last blogged about COVID-19 and kidney disease. A year later, it’s fair to ask, “What have we learned?” The obvious related questions are, “What knowledge gaps exist, and what more do we need to learn?”
As it turns out, we’ve learned quite a bit. Myriad contributions about the association between COVID-19 and outcomes in patients with kidney disease have been made by investigators around the world, and, indeed, some of the work has been done right here at CDRG. Glance at the table of contents of any kidney disease journal over the past 2 years, and you’ll be astounded to see how prominently the pandemic and its implications have been featured. It’s no exaggeration to say that these research efforts are unprecedented in the history of nephrology.
For this blog, let’s examine several questions: (i) What impact did the pandemic have on mortality in patients receiving dialysis? (ii) What happened to the prevalent dialysis census as a result of the pandemic? and (iii) What happened to patients with late-stage chronic kidney disease (CKD) who were facing transition to dialysis (the incident dialysis census)? Then we’ll speculate on some key epidemiologic questions that need answering.
First, let’s look at the all-cause mortality in patients receiving dialysis. (I’ve selected a version of the figure that specifically shows dialysis patients.)
All-cause mortality rate among patients with ESRD, 2018-2021
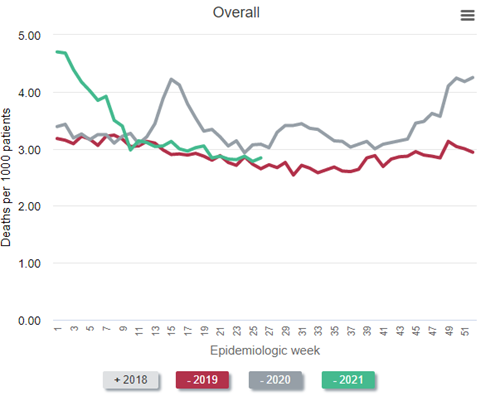
Data Source: 2020 United States Renal Data System Annual Data Report
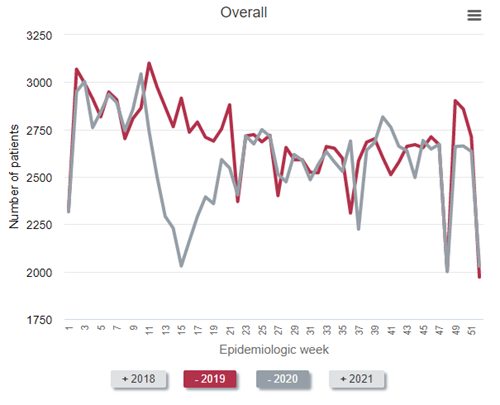
In the figure above, which is Figure 13.12a of the end-stage renal disease (ESRD) volume in the recently-released 2021 United States Renal Data System (USRDS) Annual Data Report (ADR), the red line represents all-cause mortality (measured as deaths per 1,000 persons) in 2019. Consider this red line as a prepandemic baseline pattern of weekly death rates. (Note that deaths tend to drop in the summer months and peak in December and January.) Then inspect the gray line—2020. Note the tremendous spike in weekly death rate during the first wave of the pandemic, “epidemiologic weeks” 13-23 or so (representing the last third of March to the beginning of June 2020). During week 15 (early April), the weekly death rate jumped by about 45%! After another spike during epidemiologic weeks 29-36 or so, a precipitous increase began at about week 45, or early November. The winter of 2020-2021 was calamitous: The weekly death rate per 1,000 patients receiving dialysis reached 4.7 in epidemiologic week 1 of 2021—an astounding increase of nearly 50% relative to the same period in 2019.
Were these deaths among dialysis patients due to COVID-19? The circumstantial evidence is overwhelming—what else could have happened in 2020 and 2021, compared with 2019, to have caused this? What else could have exhibited a temporal pattern that mimicked the pattern of death in the overall US population? However, it turns out we need not rely on circumstantial evidence—we have direct evidence.
Percentage of deaths due primarily to COVID-19 among patients undergoing dialysis, 2020-2021
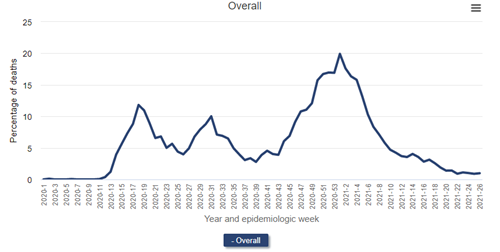
Data Source: 2020 United States Renal Data System Annual Data Report
The figure above (Figure 13.13 from the 2021 USRDS ADR) shows deaths attributed primarily to COVID-19 among patients receiving dialysis. The source is the Medicare-mandated Form 2746, or the ESRD Death Notification Form, required for all deaths of persons with end-stage kidney disease (regardless of whether Medicare was the payer). During the initial wave of the pandemic, nearly 12.0% of deaths among patients receiving dialysis were officially attributed to COVID-19 at epidemiologic week 18. During the pandemic surge in the winter of 2020-2021, fully 1 in 5 deaths were attributed to COVID-19 (epidemiologic week 1 of 2021)!
Inspect the weekly incidence of diagnoses of COVID-19 in patients receiving dialysis and the general population (the latter derived from Centers for Disease Control data) in the following figure, which is Figure 13.4 from the 2021 USRDS ADR.
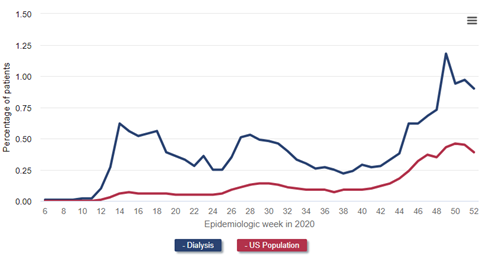
Data Source: 2020 United States Renal Data System Annual Data Report
One can easily see how much more common COVID-19 diagnoses were among patients receiving dialysis, and how the temporal patterns of COVID-19 diagnoses in the general population were greatly exaggerated in the dialysis population.
Next, let’s take a look at the prevalent dialysis census. The following figure is a reproduction of Figure 13.11 from the just-released 2021 USRDS ADR. Again, I’ve selected a version of the figure that shows only the dialysis patient census (that is, not including patients with a kidney transplant).
Number of prevalent ESRD patients, 2018-2021
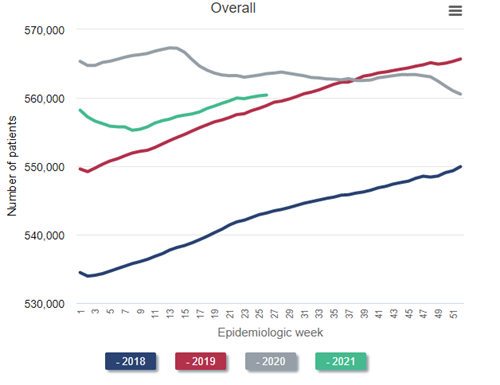
Data Source: 2020 United States Renal Data System Annual Data Report
Look at the blue line, representing the steady historical increase in the census of patients receiving dialysis throughout 2018. Naturally, the left side of the red line (2019) picks up where the right side of the blue line (2018) leaves off. Again, observe the steady growth in the dialysis census throughout 2019—exactly what would have been predicted. But then inspect the gray line (2020). Instead of a steady increase in the dialysis census throughout 2020, as would have been predicted, the census decreases during the first wave in the pandemic (around epidemiologic week 15 of 2020). This census drop is the first that has ever occurred since these data have been tracked beginning in the early 1980s. The calamitous winter of 2020-2021 resulted in a nadir in the dialysis census to 555,264 in epidemiologic week 8 of 2021 (final full week of February). This represents a decrease of over 2% from the beginning of the pandemic, but in reality represents a “deficit” of nearly 4% after one considers what the projected growth of the prevalent dialysis census “should have” been, based on historical trends, had the pandemic not occurred.
Not all of the decrease in the prevalent census can be attributed to an increase in weekly death rates among prevalent patients receiving dialysis. Some of the “dialysis deficit” is attributable to fewer patients with advanced CKD being declared as having end-stage kidney disease by virtue of initiating dialysis. Observe the findings in the figure below.
To best make the point, it is easiest to compare 2019 (the red line) to 2020 (the gray line). As can be seen, far fewer patients with newly declared end-stage kidney disease initiated dialysis from epidemiology week 11 to about week 22 in 2020—the first wave of the pandemic in the United States—compared with 2019. In fact, during epidemiologic week 15 (early April 2020), the number who initiated dialysis was about 30% below historical norms. “Only” about 2,030 individuals initiated dialysis that week—a weekly total that has not been seen for nearly a decade.
A major question that remains is “What happened to all these patients with advanced CKD approaching the need for dialysis and kidney transplantation?” Will there be a make-up “surge” in incident dialysis patients in the future? Or, more ominously, did many people with stage 5 CKD die before they ever had a chance to initiate dialysis (or receive a kidney transplant), due either to COVID-19 or to non–COVID-19 causes that became more difficult to diagnose and treat as the pandemic stressed the US health care system? The long-term effects of the pandemic on the population with kidney disease, including those with (or transitioning to) end-stage kidney disease, may be the next great research frontier in kidney disease epidemiology.
As an acknowledgement, our former CDRG colleague Eric Weinhandl, PhD, MS, led most of our COVID-19–related analyses in his capacity with the USRDS. Thanks Eric, and best of luck in your new endeavors.
__________________________________________________________________________________
Eric Weinhandl, PhD, MS, Senior Epidemiologist
September 9, 2021
Much has been written about the potential of incremental hemodialysis to improve outcomes in the early months of dialysis treatment, but what has been published can be reasonably characterized as a constellation of expert opinions and observational data analyses.
But now we have a randomized controlled trial. In a new article in Kidney International, Vilar and colleagues describe a randomized controlled feasibility trial of 55 incident hemodialysis patients in four centers in the United Kingdom. Let’s review the details.
Inclusion and exclusion criteria
Trial subjects were adults enrolled within 3 months after hemodialysis initiation. Notably, subjects were required to have a residual renal urea clearance at least 3 mL/min/1.73 m2. Patients expected to require high-volume ultrafiltration were excluded.
Intervention
Subjects randomly assigned to standard care received hemodialysis during three 3.5- to 4-hour sessions each week. Minimally adequate dialytic urea clearance was defined by weekly standardized Kt/V of at least 2.0.
Subjects randomly assigned to incremental hemodialysis received two 3.5- to 4-hour treatments per week. Minimally adequate urea clearance was likewise defined by weekly standardized Kt/V of at least 2.0, but both residual renal and dialytic urea clearance contributed to the calculation of total clearance. Notably, the trial permitted more frequent hemodialysis to achieve the urea clearance target and prevent volume overload and hyperkalemia.
Outcomes
The primary clinical outcomes were the rate of change in residual kidney function and the incidence of serious adverse events, including death, major cardiovascular events, and hospitalization for volume overload, hyperkalemia, lower respiratory tract infections, and vascular access complications. Secondary clinical outcomes included the proportion of patients with residual renal urea clearance of at least 2 or 3 mL/min/1.73 m2 or recovery of kidney function and quality-of-life scores. The usual panel of biochemical parameters, blood pressure, and medication use was recorded, as were healthcare provider costs.
Now let’s look at the results of this trial.
Residual kidney function
Slopes of both residual renal urea clearance and estimated glomerular filtration rate during 12 months of follow-up were statistically similar in the two treatment groups, although both slopes were less steep with incremental hemodialysis. The slope of residual renal urea clearance, adjusted for body surface area, is shown in the figure below.
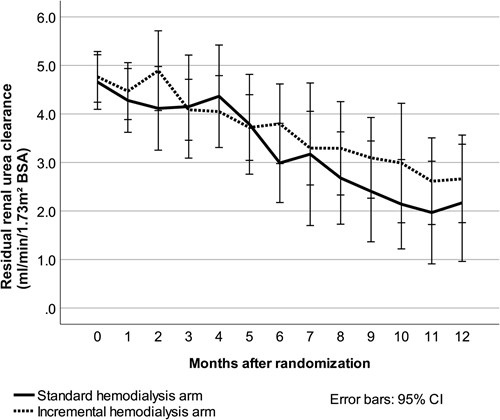
After 6 months, 92% of patients initially treated with incremental hemodialysis had residual renal urea clearance of at least 2 mL/min/1.73 m2, whereas only 75% of patients initially treated with conventional hemodialysis had clearance at that level. However, the difference was not statistically significant. With a threshold of residual renal urea clearance of at least 3 mL/min/1.73 m2, corresponding statistics were 56% with both incremental and conventional hemodialysis. Unsurprisingly, this difference also lacked statistical significance.
Serious adverse events
Remarkably, the rate of serious adverse events probably or possibly related to dialysis was only 0.9 events per patient-year with incremental hemodialysis but 1.9 events per patient-year with conventional hemodialysis. This difference was statistically significant (P=0.007).
Biochemistry
After 12 months, there were subtle differences between the two groups. Serum phosphorus increased in patients on incremental hemodialysis but not in patients on conventional hemodialysis. Meanwhile, phosphate binder dose increased to a greater extent with incremental hemodialysis than with conventional hemodialysis. In addition, serum bicarbonate decreased with incremental hemodialysis but increased modestly with conventional hemodialysis.
Between months 1 and 12 of follow-up, extracellular water increased 1.8 L in patients on incremental hemodialysis but only 0.8 L in patients on conventional hemodialysis. Although pre- and post-dialysis blood pressure changes seemed similar with both treatments, the number of antihypertensive medications per patient increased by 0.8 agents with incremental hemodialysis but only 0.1 with conventional hemodialysis.
Costs
Total costs were 19,875 British pounds with incremental hemodialysis but 26,125 British pounds with conventional hemodialysis. Costs of transport, hemodialysis, and adverse events were all lower with incremental hemodialysis.
Analysis
This was a small but provocative trial. We are seeing a mix of positive and negative signals with incremental hemodialysis. The balance of the data suggests modestly improved preservation of residual kidney function with incremental hemodialysis, although the benefit is statistically tenuous and might not be replicated in a larger randomized controlled trial. The data also show that the incidence of serious adverse events possibly or probably related to dialysis was lower with incremental hemodialysis.
On the other hand, the predictable effects of less frequent hemodialysis also seem apparent: lower serum bicarbonate, higher serum phosphorus, and greater use of both phosphate binders and antihypertensive medications. One could argue that the data on phosphorus and phosphate binders are inconsequential, considering the uncertainty about the efficacy of hyperphosphatemia treatment. Nonetheless, increasing use of antihypertensive medications and greater gains in extracellular water with incremental hemodialysis suggest to me that volume control deteriorates over 12 months of treatment. Unfortunately, we do not know how many patients were switched from two to three sessions per week, so whether proactive adjustment of the frequency can avert gradually worsening volume overload is unclear.
What is clear is that incremental hemodialysis lowers costs by nearly 25% relative to conventional hemodialysis. Much of this cost reduction can be traced to hemodialysis itself.
We need to keep assessing this strategy, preferably with larger randomized controlled trials and, eventually, with trials of US patients. Incremental hemodialysis obviously reduces healthcare spending and, frankly, reductions might be larger in the United States, considering the high cost of hospitalization. Incremental hemodialysis might better preserve residual kidney function, although the limited sample size of this feasibility trial offers weak evidence in support of this hypothesis. Incremental hemodialysis might also increase the risk of inadequate solute clearance and ultrafiltration, absent both close monitoring and proactive titration of hemodialysis frequency.
At this early time, the question foremost on my mind is this: does incremental hemodialysis provide short-term gains at the expense of long-term losses? Preservation of residual kidney function is clearly important, but we must preserve enough of that function to outweigh the risk of compromising cardiovascular health later in the course of dialysis.
__________________________________________________________________________________
Allyson Hart, MD, MS, Senior Staff for Patient and Family Affairs
August 4, 2021
I fell in love with research when I was studying epidemiology as a nephrology research fellow. I felt the same ripple of excitement building statistical models as I had years before studying the biochemistry that led me into medicine and, ultimately, to nephrology (yes, I am aware that I am an uber nerd….perhaps a topic for another blog). I also loved the idea of contributing to knowledge that might help patients.
As happens with any new knowledge, I was immediately struck by how easy it was to get the wrong answer. This statement will shock no one engaged in research—it is the reason we include a “limitations” paragraph in our publications and call for validation studies in different populations. My favorite epidemiology and biostatistical mentors were clear on defining what questions could and could not be answered by our models. As I developed my own interests and research questions, I gravitated toward collaborators who valued seeking the right answer, not a “significant” p-value.
I am also a pragmatist, raised by folks who would sooner weld an old scrap of metal into a circle than spend 50 cents on a new D-ring at the hardware store. They used their tools to solve the problem at hand, and ideally, had a garage full of tools.
It turns out that pragmatism constitutes a distinct philosophical approach to biomedical research. When I started working with Chronic Disease Research Group (CDRG) and Scientific Registry of Transplant Recipients (SRTR) staff, I was excited about the prospect of using these incredible datasets to create calculators that would inform patient and provider decisions. I wanted to bring the epidemiology several steps closer to key stakeholders than a publication in a journal reporting relative risks, akin to moving a promising molecule in the lab closer to being a pill or injection at the bedside. But, as happens with all the best science, starting to answer one question (eg, how can we make a calculator to show likely outcomes on the kidney transplant waiting list?) led to several more questions: What exactly do patients need to know to make the best decisions for themselves? How does this differ (if at all) from what patients want to know? How are data best presented to help people understand risk and probability? How do decisions differ when we present data as survival vs mortality probabilities? When in the course of a patient’s care should this information be shown to them? Do patients even want to know this information?
These are questions that quantitative research methods simply cannot answer. Even worse, these are questions for which quantitative methods are at risk for giving us the wrong answer. An unintentionally poorly worded survey that isn’t informed by careful qualitative methods has great potential to lead us astray—even if we send it to 10,000 people and get a 90% response rate. Furthermore, we now recognize that science’s standard practice of coming up with research questions in our “ivory towers” has resulted in decades of research that misses what matters most to patients, such as a dearth of solid research on what “quality of life” really means to them.
My sense is that the tide is turning. Patients are calling for us to hear their voices and address the issues that matter to them through qualitative methods. Furthermore, patients need a seat at the table, engaged in the research process itself as collaborators to teach us how to conduct research in a way that doesn’t continue to marginalize, ignore, disenfranchise, and harm traditionally underserved populations. For the first time since its inception, SRTR is including focus groups in its data collection methods and has created the Patient and Family Advisory Subcommittee of the SRTR Review Committee to guide methodologic approaches and research initiatives.
Biostatistics and epidemiology are critical tools to advance medical science to improve patient care, but they are even more powerful when combined with participant engagement and qualitative methods. Collaboration and multidisciplinary teams are the way to take our statistical models from published hazard ratios to agents of change in people’s lives. Let’s work together to use all the tools in our toolbox.
__________________________________________________________________________________
Andrew Wey, PhD, Principal Biostatistician
July 1, 2021
On February 4, 2020, a new organ allocation system was implemented for liver transplant. The system, called “acuity circles,” dramatically changed the allocation of livers across different categories of pediatric and adult models for end-stage liver disease (P/MELD) scores.
P/MELD is the measure of disease severity for patients on the liver transplant waiting list. As part of the operation of the Scientific Registry of Transplant Recipients, the Chronic Disease Research Group (CDRG) created an online application for monitoring acuity circles because of the new system’s potentially large effect on access to liver transplant.
As the figure below illustrates, acuity circles dramatically increased deceased donor offers and transplant rates for liver patients with P/MELD scores of 29 to 36.
To learn more about the effect of acuity circles, please visit the online application or our abstract for the 2021 American Transplant Congress.
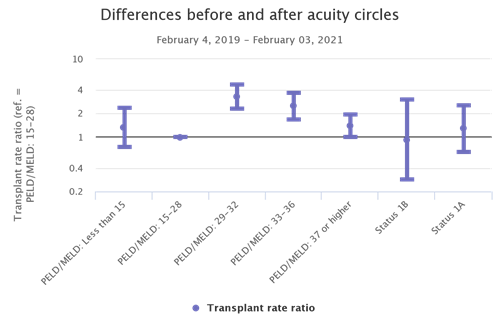 __________________________________________________________________________________
Eric Weinhandl, PhD, MS, Senior Epidemiologist
June 10, 2021
Dialysis facilities are evaluated according to numerous quality measures. Those measures feed into multiple programs, including Care Compare, Dialysis Facility Reports, and the End-Stage Renal Disease (ESRD) Quality Incentive Program.
The hallmark measure in the federal landscape is the standardized fistula ratio (SFR). As with any standardized ratio, the measure assesses whether the number of patient-months with an arteriovenous fistula (AVF) is higher or lower than expected, given the mix of patients within a dialysis facility. Specifically:
In practice, the measure aims to identify dialysis facilities in which AVF use among adult hemodialysis patients is lower than expected.
In general, measures are effective when there is room for improvement. Admittedly, the percentage of hemodialysis patients with an AVF in the United States is lower than the corresponding percentage in Japan. From that point of view, and coupled with the observation of a relatively low rate of death among Japanese patients undergoing dialysis, even the United States has room for improvement. However, there is value in taking a step back and evaluating the United States as it is. Below is a figure about the distribution of vascular access types among all hemodialysis patients, per CROWNWeb data, between 2012 and 2018.
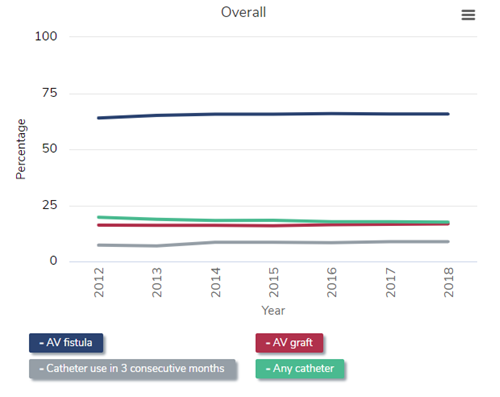
The stability of the distribution of vascular access types brings us back to the core issue of whether a measure is effective. The above figure suggests that the era of the standardized fistula rate has not been one in which fistula utilization has increased. I hesitate to say that the measure is “topped out,” as is the case with dialysis adequacy (ie, Kt/V), but there is a case to be made that if the United States were capable of reaching 70% or 80% AVF utilization with currently available technology and procedures, it would have already occurred.
If we accept that hypothesis for a moment, we must consider alternative measures that might address current gaps in vascular access care and further improve outcomes. To that point, let us look at the development of outcomes in the vast majority (approximately 80%) of incident ESRD patients who begin hemodialysis with a central venous catheter.
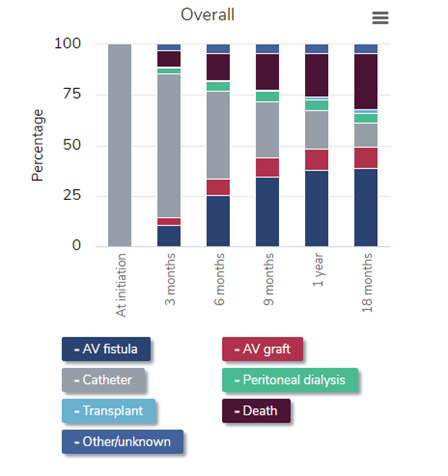
It is time for the nephrology community—and the arbiter of quality measures, the Centers for Medicare & Medicaid Services—to consider a measure that addresses this process. One proposal is to measure the adjusted cumulative incidence of fistula use at 12 months. Of course, some methodological decisions must be made, including how to address the competing risk of death and which adjustment factors to include in the statistical model. Another, more challenging issue is statistical reliability. With roughly 125,000 patients initiating dialysis each year, about 85% of those patients using hemodialysis, and 80% of hemodialysis patients having a catheter at dialysis initiation, we have 85,000 patients per year in the “denominator.” However, with more than 7,000 dialysis facilities across the country, about 12 catheter-dependent patients initiate hemodialysis each year in an average dialysis facility. That is a real constraint on the reliability of a measure. One tactic is to use multiple years of data; another tactic is to pool multiple dialysis facilities into a single unit of analysis, akin to the aggregation unit of commonly owned dialysis facilities within a market, per the ESRD Treatment Choices payment model.
Quality measures ought not to be fixed in place forever. Instead, quality measures should adapt to the needs of the era. The first decade of this century witnessed fantastic expansion of AVF use, but the second decade has not. We should react to this state of affairs by targeting a vascular access measure to an apparent gap in care. The slow transition from catheter dominance to AVF dominance during the first 12 to 18 months of hemodialysis is one such gap that requires focus.
__________________________________________________________________________________
Nicholas Salkowski, PhD, Principal Biostatistician
May 4, 2021
The Chronic Disease Research Group (CDRG) currently operates the Scientific Registry of Transplant Recipients (SRTR). One job of SRTR is to provide publicly available metrics of organ transplant program performance. For example, SRTR produces metrics related to graft and patient survival during the first year following an organ transplant.
The simplest approach to measuring graft or patient survival would be to provide the percentage of surviving grafts and patients. This, however, isn’t a good way to measure program performance because donor organs and patients have different risk profiles. A good metric needs to consider the fact that different programs take different risks.
Risk Adjustment
SRTR uses a model to predict the risk for each transplant. That way, if a program treats higher-risk patients, the predicted number of graft failures or deaths will be higher. If there were no risk adjustment, the programs that looked best would likely be those that took the fewest risks.
So, SRTR looks at the number of observed events (graft failures or deaths) as well as the number of expected events predicted by the risk adjustment model. One possible performance metric could be the ratio of observed to expected events. An observed/expected ratio less than 1 indicates that a program is doing better than expected, because there were fewer than expected observed events. An observed/expected ratio greater than 1 indicates more events than expected, and a ratio precisely equal to 1 indicates that a program has exactly the expected number of events.
Ratio Metric Issues
The observed/expected ratio works fairly well for larger programs, because they have a lot of data. Suppose a large program is expected to have 20 events. If there were 19 observed events, their ratio would be 0.95, a little better than expected. If there were 21 events, their ratio would be 1.05, a little worse than expected.
The observed/expected ratio doesn’t work well for smaller programs. Suppose a small program is expected to have 0.5 events. If there were zero observed events, the ratio would be zero. This estimates that there is no risk at all, which is nonsense. Even the best programs have some risk. If there were 1 event, the ratio would be 2. That suggests that the risk is quite high. This happens even though observing zero events or 1 event is quite likely if the program is perfectly average. After all, 0.5 events can’t be observed.
Shrinkage
SRTR uses shrinkage to keep the metrics from overreacting to limited amounts of data. If you flip a coin once and observe “heads” once, it would be an overreaction to say that the probability of “tails” was zero, even though that would be perfectly consistent with the very limited data set. Instead of looking at the ratio of observed to expected events, SRTR looks at the ratio of (observed + 2) to (expected + 2). This doesn’t change the ratio for large programs much. Instead of 19/20 = 0.95, the ratio is 21/22 = 0.955. Instead of 21/20 = 1.05, the ratio is 23/22 = 1.045.
This makes a much bigger difference for small programs. Instead of 0/0.5 = 0, the ratio is 2/2.5 = 0.8. Instead of 1/0.5 = 2, the ratio is 3/2.5 = 1.2. The metric still indicates that the program is doing better or worse than expected, but the response to limited data is less extreme.
Metrics like these are called shrinkage estimators because the ratio estimate “shrinks” toward 1. For large programs, 0.955 is closer to 1 than 0.95, and 1.045 is closer to 1 than 1.05. For the small program, 0.8 is closer to 1 than 0, and 1.2 is closer to 1 than 2. The shrinkage is a function of how much data is available for each program. More precisely, it is a function of how many events are expected at each program. The fewer the expected events, the more the ratio shrinks toward 1. The more events are expected, the less shrinkage there will be.
__________________________________________________________________________________
Cory Schaffhausen, PhD, Human Centered Design Engineer
April 1, 2021
What is SRTR?
The Scientific Registry of Transplant Recipients (SRTR) is a national registry of data on all transplant candidates, recipients, and deceased donors. The Health Resources and Services Administration (HRSA) recently renewed SRTR’s 5-year contract under the Chronic Disease Research Group (CDRG). One part of the contract tasks SRTR with creating reports on the performance of the solid organ transplant system and sharing these reports with the public.
In recent years, SRTR updated reports that traditionally were technical and suited for transplant programs and medical professionals. While SRTR worked to make this information more patient-friendly with web-based reports, this effort was not facilitated with a specific process in the contract language.
The SRTR contract awarded in 2020 includes new requirements to establish a systematic process to improve how the transplant community uses solid organ transplant data. Human-centered design will help with the process.
What is human-centered design?
Commonly called “design thinking,” human-centered design is a methodology for creating design solutions that meet user needs. Design methods are systematically applied to identify user needs and significant design constraints. The methods are an iterative process that can quickly identify deficiencies in potential solutions. Stanford University has popularized one version of the human-centered design process, which includes five phases: empathize, define, ideate, prototype, and test. SRTR can use this model to meet the challenge of disseminating data to a variety of stakeholders.
How is human-centered design used at SRTR?
SRTR plans to evaluate current transplant metrics and learn about opportunities to improve, expand, and distribute them to meet the needs of transplant stakeholders. SRTR can follow the five-phase design process, as outlined below.
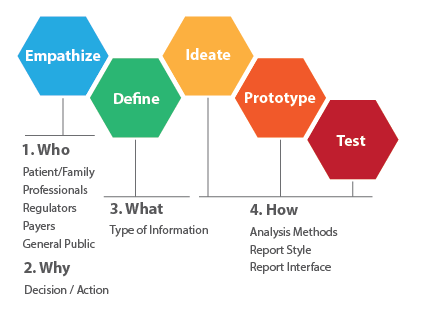
Step one is understanding who uses SRTR data, such as patients, families, living donors, professionals, and regulators. Because each stakeholder has different needs, SRTR needs to assess how each one might use SRTR data for decision making (eg, to understand why users seek information about a specific transplant metric or where to seek care, or in the case of providers, contemplate restrictions for adding candidates to the waiting list).
Empathizing is often qualitative, including interviews or patient focus groups to understand their perspectives. The same qualitative process can be used to understand the needs of clinicians and researchers.
The next step is to clearly define the metrics or information that influence a decision for specific stakeholders. Information can be used in different forms; some decisions may benefit from risk-adjusted metrics, while others may require a simple count of donors or patients with similar characteristics. The design process identifies the type of data needed to inform a decision.
The design process then uses iteration to create a solution. Ideation refers to a divergent process such as brainstorming to identify potential solutions. Concepts can be prioritized subjectively or with defined criteria, and the most promising solutions are explored with prototypes. For transplant metrics, this may include multiple approaches to displaying a particular metric on a page or screen. A prototype can be a nonfunctional mockup created with minimal effort and quickly refined. An example of SRTR work has been creation of a prototype mockup of a web-based data report with the look of a webpage without the need for programming. A prototype can generate useful feedback during testing with potential users. Feedback received can initiate refinements or new concepts or definitions of the problem. After feedback and iterative refinements, a final prototype can be identified and used as a template for the creation of functional public reports.
Human-centered design is becoming an important tool for SRTR. A similar process can be applied to other SRTR tasks, such as creating patient- or provider-facing decision support tools. This systematic approach can promote continuous improvement of information for the transplant community and thus drive system improvements.
__________________________________________________________________________________
Eric Weinhandl, PhD, MS, Senior Epidemiologist
March 11, 2021
In another time, a title like “The Real World” might evoke thoughts about MTV. But times have changed. In today’s medical research, “The Real World” now conjures associations about an altogether different acronym: FDA, or US Food and Drug Administration.
The 21st Century Cures Act, which became law in 2016, codified real-world evidence (RWE) as “data regarding the usage, or the potential benefits or risks, of a drug, derived from sources other than traditional clinical trials.” Part and parcel with RWE are real-world data (RWD), which arise from many familiar sources, including:
Why is RWE needed?
Most people in academia and industry are familiar with randomized clinical trials. In such studies, participants are randomly assigned to one of two or more treatment groups. A group might receive an active intervention (eg, investigational drug), the standard of care, or a placebo. In the widely discussed trials of COVID-19 vaccines, study participants were randomly chosen to receive either the investigational vaccine or a placebo injection. Randomized clinical trials are essential for establishing the efficacy and safety of interventions, including new drugs.
However, trials also have important limitations. Trials are guided by prespecified protocols that identify inclusion and exclusion criteria and treatment details (eg, active intervention dosing, primary and secondary outcomes, follow-up schedule). These details are essential for ensuring that a valid scientific inference can be extracted from the trial. Indeed, the details in a trial protocol and the language in a prescription drug’s package insert are closely connected. Nevertheless, these details create constraints on what we can know about an investigational drug when used in clinical practice.
Consider these scenarios:
All these scenarios create the need for RWE. Analyzing data accumulated during clinical practice can help determine whether drugs are likely effective in different indications and with dosing schedules not contemplated in initial randomized clinical trials. Data from clinical practice can also be used to assess the incidence of events that occur too infrequently to be observed in initial randomized clinical trials.
Another reason for RWD is establishing cost-effectiveness. Admittedly, most randomized clinical trials are aimed at establishing the medical properties of active interventions. Very few trials contemplate whether a drug is cost-effective. This is an increasingly important consideration as pay-for-performance and value-based payment models proliferate among private and public health insurance programs. RWD can provide visibility into changes in life expectancy and healthcare utilization (including hospitalization) and drug, device, and procedure costs in clinical practice.
How can CDRG help?
The Chronic Disease Research Group (CDRG) has a wealth of resources that can help drug and device manufacturers develop RWE.
Notably, CDRG has extensive experience with healthcare claims data. The details of claims data differ among payers, but the core elements are the same:
Over the years, CDRG has analyzed and published data extracted from commercial and Medicare claims. CDRG also has experience with Medicare Advantage and Medicaid claims data. Our team includes physician investigators, epidemiologists, and biostatisticians with expertise in data management, study design and analysis, and scientific communications.
The reality, so to speak, of RWD is that making sense of data is very difficult. Large administrative datasets tend to be very chaotic. Claims may arise from inpatient and outpatient settings and be documented with codes from multiple taxonomies, including the International Classification of Diseases, Tenth Revision, Clinical Modification (ICD-10-CM); the Current Procedural Terminology (CPT); the Healthcare Common Procedure Coding System (HCPCS); and National Drug Codes (NDCs). Ascertaining comorbidities, the use of drugs and devices, and even clinical outcomes requires detailed knowledge of code taxonomies, clinical definitions that pool relevant codes, and care settings in which codes are expected to be used. Assessment of cost-effectiveness also requires understanding coverage and payment policies applicable to the dataset at hand. CDRG is especially fluent in coverage and payment policy pertaining to Medicare Parts A, B, C, and D.
Ultimately, experience matters when developing RWE that can influence clinical practice and healthcare policy. Many groups throughout the United States can use RWD to develop descriptive analyses of utilization and costs. CDRG is uniquely adept at transforming RWD into RWE suitable for publication in peer-reviewed research journals and can guide healthcare professionals, payers, and regulators toward improving health outcomes in a cost-efficient manner. We look forward to working with you.
__________________________________________________________________________________
Eric Weinhandl, PhD, MS, Senior Epidemiologist
December 1, 2020
Coronavirus disease 2019 (COVID-19) has drastically changed our world. By objective measures, the United States has fared poorly in addressing the pandemic, with a cumulative COVID-19 death rate of about 800 per million people in late November.
Across the world, it has become clear that vulnerable populations are at high risk for COVID-19 infection and severe complications. One such population includes people undergoing maintenance dialysis for the treatment of end-stage kidney disease (ESKD). The United States hosts the second-largest population of dialysis patients in the world, after China. Nearly 90% of the roughly 550,000 dialysis patients dialyze three times per week in facilities bustling with patients and staff working multiple shifts.
As part of the United States Renal Data System (USRDS) Annual Data Report, we recently published a first analysis of the impact of COVID-19 on dialysis patients. You can read the entire analysis here. In this blog entry, I mention a few highlights and ask some questions about what it may all mean as we approach 2021.
COVID-19 hospitalizations
From epidemiologic week 8 (February 16 to 22) to week 27 (June 28 to July 4), COVID-19 hospitalizations began to occur among about 300,000 dialysis patients with Medicare coverage. The weekly rate of COVID-19 hospitalizations increased rapidly from week 11 to 15, reaching a peak of more than four admissions per 1,000 patients per week. After that time, the weekly rate of hospitalizations steadily declined to a nadir in week 24 (June 7 to 13) but nearly doubled during the remainder of June and the first days of July. There were more than 11,200 COVID-19 hospitalizations among dialysis patients with Medicare coverage in this 20-week period.
Rate of COVID-19 hospitalizations among Medicare fee-for-service beneficiaries receiving dialysis
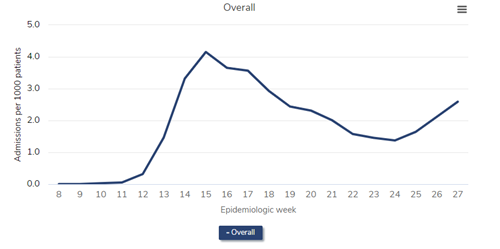
Data Source: 2020 United States Renal Data System Annual Data Report
In-center and home dialysis
From epidemiologic weeks 8 to 27, trends in weekly rates of COVID-19 hospitalizations were similar in patients undergoing hemodialysis (nearly always in a dialysis facility) and those performing peritoneal dialysis (nearly always at home). Despite similar trends, patients on hemodialysis were hospitalized with COVID-19 three times more often than patients on peritoneal dialysis.
Rate of COVID-19 hospitalizations, by dialysis modality, among Medicare fee-for-service beneficiaries receiving dialysis
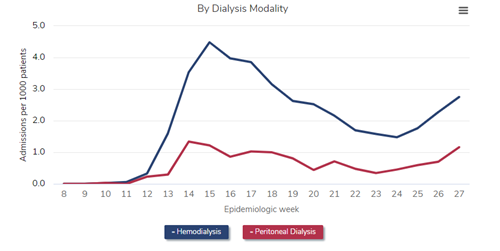
Data Source: 2020 United States Renal Data System Annual Data Report
Excess death
One way of quantifying the impact of COVID-19 on risk of death in dialysis patients is to compare rates of all-cause death during 2020 versus the same period in previous years. We compared all-cause death among all patients undergoing dialysis during epidemiologic weeks 8 to 27 of 2020 versus those same weeks in 2017, 2018, and 2019. From weeks 13 to 17, the death rate in 2020 was 32% higher than during the same 5-week intervals in 2017-2019. From weeks 18 to 22, the death rate was 18% higher in 2020 versus 2017-2019, and from weeks 23 to 27, the death rate was 14% higher in 2020 versus 2017-2019.
All-cause mortality among all prevalent patients undergoing dialysis
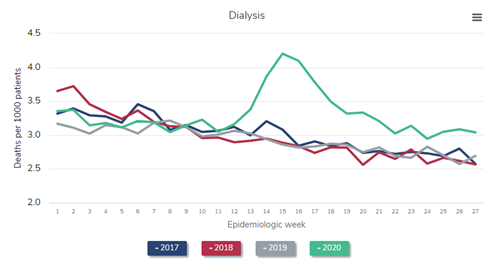
Data Source: 2020 United States Renal Data System Annual Data Report
Non–COVID-19 hospitalizations
In contrast to the rates of COVID-19 hospitalization and death, the rate of non–COVID-19 hospitalizations among dialysis patients with Medicare coverage sharply declined during the second quarter of 2020. From weeks 13 to 17, the non–COVID-19 hospitalization rate in 2020 was 32% lower than during the same 5-week intervals in 2017-2019. Thereafter, rates gradually approached historic norms. From weeks 18 to 22, the non–COVID-19 hospitalization rate was 20% lower in 2020 versus 2017-2019, and from weeks 23 to 27, the non–COVID-19 hospitalization rate was only 12% lower in 2020 than in 2017-2019.
Rate of non-COVID hospitalizations among Medicare fee-for-service beneficiaries receiving dialysis
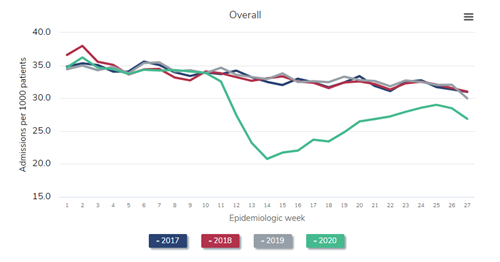
Data Source: 2020 United States Renal Data System Annual Data Report
ESKD incidence
One might expect that the incidence of ESKD could not possibly be affected by acute changes in health care delivery, because patients with advanced chronic kidney disease (CKD) are likely to progress incrementally toward ESKD, regardless of a pandemic. However, during the 12-week period from March 8 to May 30, nearly 5,000 fewer patients than expected, in light of weekly norms in 2017-2019, were reported as having incident ESKD.
Weekly count of incident ESKD patients
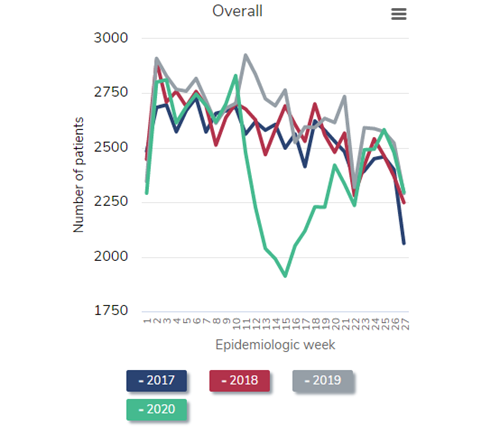
Data Source: 2020 United States Renal Data System Annual Data Report
What does all this mean?
Having studied the epidemiology of the dialysis patient population in the United States for more than 15 years, I can confidently assert that the impact of COVID-19 on this population is unprecedented. To observe large discrepancies in dialysis patient hospitalization and death rates, as well as a tremendous deficit of patients with incident ESKD, is truly shocking. The implications of these data are profound, not only for the health of current patients with advanced CKD and ESKD, but also for the future of dialysis patient care. Let me share a few thoughts before I wrap up.
Ultimately, let us all hope that COVID-19 is soon dealt a blow by the promising news of vaccines. Let us hope, in particular, that dialysis patients will be afforded early access to these vaccines so that they and their families, as well as all the medical professionals who care for them, might be relieved of this tremendous burden.
__________________________________________________________________________________
Eric Weinhandl, PhD, MS, Senior Epidemiologist
November 2, 2020
On July 10, 2019, US President Donald Trump issued the Executive Order on Advancing American Kidney Health. It declared, in part, the country's policy is to “increase patient choice through affordable alternative treatments for [end-stage renal disease (ESRD)] by encouraging higher-value care, educating patients on treatment alternatives, and encouraging the development of artificial kidneys.”
That same day, the Centers for Medicare & Medicaid Services (CMS) issued a preliminary form of ESRD Treatment Choices (ETC), a payment model aimed at increasing home dialysis and kidney transplants in Medicare beneficiaries undergoing dialysis. As proposed, ETC would take effect on January 1, 2020.
On September 16, 2019, the comment period on ETC closed.
And then there was silence. Month after month passed without meaningful news, except for an opaque message on the Office of Information and Regulatory Affairs website indicating that a final rule would be posted within 3 years—no later than July 2022!
And yet, nearly 1 year to the day after the comment period closed, CMS posted on its website a final form of ETC with a start date of January 1, 2021.
The technical details of ETC will be the subject of many essays and webinars, so I want to take this opportunity to ask five provocative questions about how the world will adapt.
1. Will Medicare Advantage mess everything up?
This issue has nothing to do with home dialysis. However, we are now a few weeks into Medicare open enrollment, and for the first time, patients on dialysis currently enrolled in traditional Medicare may sign up for a Medicare Advantage plan. The plan would assume responsibility for health care claims on January 1. And with that, the insured patient would disappear from the denominator of ETC.
Indeed, ETC is a payment model that addresses only patients enrolled in traditional Medicare. Today, there are about 310,000 such patients, but that number is likely to decline between now and January 2021. That change, by itself, is nothing more than a statistical wrinkle, but a bigger question remains: what happens if a drawdown of the traditional Medicare population leads to a residual population that is more complex, with more comorbidities and more challenging socioeconomics? Because ETC is moving forward without risk adjustment, every step forward in growing home therapies could run up against an increasingly complex array of circumstances among patients still enrolled in traditional Medicare.
Now, the truth of the matter is that CMS can see modality use among patients enrolled in Medicare Advantage plans. CROWNWeb facilitates modality characterization across the entire population. At some point, CMS may need to base measures on all Medicare beneficiaries, even if payment bonuses and penalties are applied only to fee-for-service claims. Time will tell how this plays out. As we move forward, it will be very important for CMS, dialysis providers, and nephrology practices to communicate with each other so that ETC meshes with the push and pull of traditional Medicare versus Medicare Advantage.
2. How do you make the flower grow?
Home dialysis consists of two modalities: peritoneal dialysis and home hemodialysis. For many health care professionals outside of nephrology, home dialysis and peritoneal dialysis are one and the same. Even inside nephrology, home dialysis growth is often implicitly gauged by the percentage of incident ESRD patients who start peritoneal dialysis training. Ultimately, I believe that inspiring incident ESRD patients to select home dialysis is the best long-term strategy. Many new patients are excellent candidates for peritoneal dialysis. But let’s think about the math.
Imagine a dialysis facility with a census of 70 patients. If we assume a ratio of five patients already on dialysis for every one patient initiating dialysis, this facility could be expected to have 14 incident ESRD patients per year.
Now, traditional Medicare constitutes about 60% of the existing dialysis population, so the facility has 42 such patients. Incident ESRD patients are a little less likely to have traditional Medicare, partly because of preexisting Medicare Advantage enrollment and partly because of private insurance. Let’s imagine that six of the 14 incident ESRD patients have traditional Medicare coverage.
Considering prevailing rates of death and transplant, I would assume that established dialysis patients spend, on average, 10 months per year in the facility. That gives us 420 patient-months in the frame of ETC. The incident ESRD patients with Medicare coverage arrive in the facility at different times during the year so, on average, those six patients each spend six months per year in the facility. That gives us 36 patient-months.
Do you see where this is going? Facility-wide, 456 patient-months qualify as “beneficiary months” in ETC. If we can interest two of six incident ESRD patients in home dialysis, we’ll add 12 patient-months of home dialysis and increase home dialysis use by 2.6%. On the other hand, if we can interest two of 42 established dialysis patients in switching to home dialysis during the first quarter of the year, we’ll add 18 to 20 patient-months of home dialysis and increase home dialysis use by about 4%. Which challenge do you like? Home dialysis in two of six? Or home dialysis in two of 42?
Of course, incident ESRD patients and established dialysis patients are not the same. The former group has residual function and less advanced cardiac disease. The latter group is more likely to be anuric and have left ventricular hypertrophy or even heart failure and, without a doubt, is much more likely to have a functioning fistula or graft. Frankly, from a clinical perspective, the established dialysis patient is a pretty good candidate for home hemodialysis.
Maybe ETC is less about peritoneal dialysis versus home hemodialysis and more about home dialysis in incident ESRD patients versus established dialysis patients. In any case, there is a fork in the road, and strategies will vary.
3. There is a third modality.
No, I’m not referring to hemodiafiltration or sorbent dialysis. In a surprising twist, CMS finalized ETC with a “half-credit” path toward home dialysis. That path is paved by in-facility, self-care dialysis. Each dialysis facility claim annotated with condition code 72 counts for half of a home dialysis patient-month.
What is in-facility, self-care dialysis? Well, that’s a great question, but there is no point in reading my answer when you can listen to a real expert, Richard Gibney, MD, a longtime nephrologist in Waco, Texas.
This modality has great potential but is rarely used. Medicare processed fewer than 3,000 claims for in-center, self-care dialysis during all of 2018. What’s in the future? What form will self-care dialysis take? Will self-care dialysis be monitored by CMS or state surveyors? The truth is that I have more questions than answers. However, I suspect that a well-designed self-care model can improve outcomes in the dialysis facility and serve as a springboard to home dialysis. If self-care necessarily involves self-cannulation, a big piece of home hemodialysis training is complete before training even begins.
4. Will new providers enter the market?
I doubt that 2021 will witness an unusually large influx of newly certified dialysis facilities, but the stark reality of ETC is that one facility phenotype is highly incentivized: one that offers only home dialysis. Now, it is true that a facility must amass at least 11 patient-years of dialysis with traditional Medicare coverage to participate in ETC, for better or worse. Thus, a fledgling facility may not be “in” ETC, even if it is in a selected Hospital Referral Region. However, if a facility that offers only home dialysis meets the volume threshold, it is technically a winner, at least with respect to four of the six points in the Modality Performance Score. Stated another way, home dialysis use in a facility that offers only home dialysis is 100%, which qualifies it for four of four home dialysis points via the achievement scale.
Is this good? Is this bad? The answer is: it depends. New dialysis providers that focus on home dialysis may be great additions to the market, if they deliver high-quality home dialysis support. However, the converse is also possible. A poorly run facility that offers only home dialysis might churn through patients and post a 1-year home dialysis attrition rate exceeding 50%. In the worst case, these patients suffer medical complications that result in home dialysis attrition only to be forced to change dialysis providers. This is an area that will bear watching, as there is clear promise and peril.
5. Wait-listing is the goal.
In the preliminary form of ETC, two of the six points in the Modality Performance Score reflected the transplant rate among dialysis patients in a facility. In response to public comments, CMS changed course and adopted a measure that combines waiting list prevalence and living donor kidney transplant incidence. In my estimation, waiting lists will amount to more than 30 parts for every one part living donor kidney transplant in this performance measure. Let’s be clear: one-third of ETC is about registering more dialysis patients on the transplant waiting list.
I’m not the foremost expert on transplant waiting list dynamics, but I think it’s fair to say that we’ll have some creative tension between dialysis providers and transplant centers. Dialysis providers and nephrology practices participating in ETC will want to see more patients on dialysis registered on the transplant waiting list. Transplant centers will likely see more referrals and, in turn, more demand for transplant candidate evaluation. Waiting lists may grow, and because growth is likely to be concentrated among patients with more complex comorbidities, waiting list death rates may increase. Patients receive credit for time on dialysis, not time on the waiting list. Established dialysis patients newly listed in response to ETC may assume high positions on the waiting list, which could alter the organ offer process in meaningful ways.
6. By the way, how am I doing?
It suffices to say that home dialysis use exhibits much variation among Hospital Referral Regions in the United States. Here is a map that summarizes use among all dialysis patients at the end of 2018:
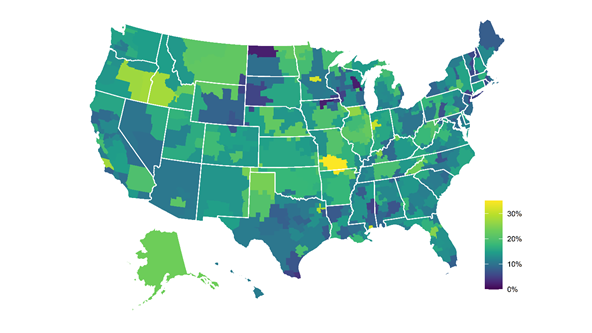
How does one begin to make sense of this? I have a theory that nephrology fellowship location influences this map, but that’s one to test on a different day. What is apparent is that even in the Midwest, pockets around Mason City, IA and Appleton, WI have <5% home dialysis use and, relatively nearby, pockets around St. Cloud, MN and Springfield, MO have >30% home dialysis use.
Variability is part of the rationale for ETC. My point is not so much the variability, shocking as it is, but how dialysis providers and nephrology practices will need data reports to quantify absolute and relative performance in home dialysis use and transplant waiting list prevalence among patients with traditional Medicare coverage. Who will provide those data? Does CMS have a plan to distribute data? I will say this: the Chronic Disease Research Group can help you. Please contact us if you need help. We have a wealth of experience with analyzing Medicare fee-for-service claims and waiting list data.
In any case, the first data report that CMS must deliver to the community is the set of percentiles of home dialysis use and transplant waiting list prevalence among facilities and practices not participating in ETC, as these percentiles will establish the achievement scale.
ETC is an incredible experiment, and although it may seem as if I harbor a lot of skepticism about how the model will play out, I give CMS a lot of credit for pushing forward. There is great potential in ETC, but as with all models, good intentions can go awry. The best scenario includes more kidney transplants and home dialysis and, most important, healthier lives for people with ESRD. With a spirit of cooperation, that scenario can be realized.
__________________________________________________________________________________
Jon Snyder, PhD, MS, Director of Transplant Epidemiology
October 2, 2020
As I enter my 21st year as an epidemiologist in the field of solid organ transplantation, I am reminded of the healing and hope that organ donation and transplant brings to those facing a diagnosis of end-organ failure. In my inaugural contribution to the Chronic Disease Research Group (CDRG) blog, I hope to impart my respect and amazement for this field of medicine and attest to how it is meeting current challenges.
Before I address current challenges, let’s set the stage. Since the first kidney transplant in 1954 and passage of the National Organ Transplant Act (NOTA) in 1984, the field of solid organ transplantation has grown to include kidney, liver, heart, lung, pancreas, intestine, and vascularized composite allograft (VCA) transplantation. A change in federal regulations in 2014 added VCAs to the definition of solid organ transplant. VCAs include transplants of the face, scalp, upper limbs (arms), abdominal wall, and reproductive organs, including the penis and uterus.
In 2019, transplant surgeons performed a record number of 39,719 transplants, an impressive 9% increase over 2018. These life-saving or life-enhancing transplants were made possible by 7,387 living donors and 11,870 deceased donors, an 8% and 11% increase over 2018, respectively.1
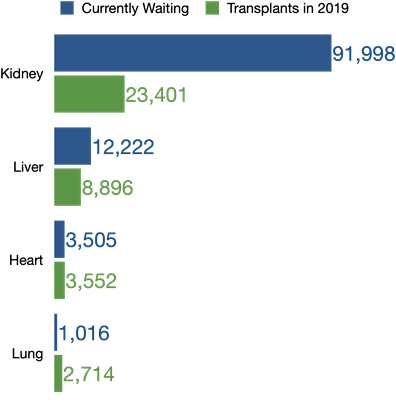
However, the demand for transplants continues to exceed organ donations, despite these impressive gains. As of September 17, 2020, 108,945 patients were on the national waiting list. Patients who need a kidney or liver outnumber the transplants performed the previous year by far. Although the number of heart and lung transplants in 2019 surpassed that of waitlisted patients, 223 heart candidates died on the waitlist, and 301 were removed after becoming too sick to undergo transplant. Another 146 lung candidates died waiting, and 166 were removed due to declining health. Considering all organ waitlists, 5,164 candidates died waiting, and 5,752 were removed due to illness.
Transplant is made possible through generous gifts of living and deceased organ donors, and CDRG continues to support multiple efforts to increase organ donation. The Health Resources and Services Administration recently awarded CDRG the Scientific Registry of Transplant Recipients (SRTR) 5-year contract, marking CDRG’s 11th year operating SRTR. As part of SRTR work, CDRG also handles the Living Donor Collective, a registry that evaluates participants to become living liver or kidney donors. By expanding this registry on a national level, SRTR plans to study long-term outcomes of living donors to further understand and inform the field of living organ donation.
Procuring organs from deceased donors begins with donation authorization, either first-person (eg, organ donor designation via driver’s license) or with permission from next of kin. CDRG works with Donate Life America to produce the Registry Overview Report, which tracks nationwide progress for organ, eye, and tissue donor registration. The number of designated organ donors in state-based registries has nearly doubled over the time period shown, from 79,702,797 in 2008 to 158,556,330 in 2019. In addition, the National Donate Life Registry contained more than 5 million registrations by the end of 2019.
Trend in State-Based Donor Designations
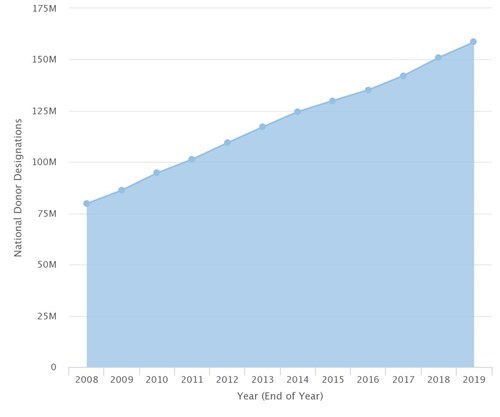
Under SRTR, CDRG also supports the nation’s transplant system by producing the OPTN/SRTR Annual Data Report. Published each year in the American Journal of Transplantation (AJT), CDRG produces semiannual reports on the performance of transplant programs and organ procurement organizations (OPOs) to improve organ allocation policy development. The Organ Procurement and Transplantation Network (OPTN) is developing organ allocation policies according to a continuous distribution framework, as illustrated by an SRTR publication in AJT.
While we celebrate successes in the field, 2020 has been a challenging year. COVID-19 caused rapid changes at donor hospitals, OPOs, and transplant programs. SRTR recently launched a web application detailing the pandemic’s impact on the national transplant system. The monthly number of kidney transplants declined 45% in the month after the national emergency declaration (see figure below).
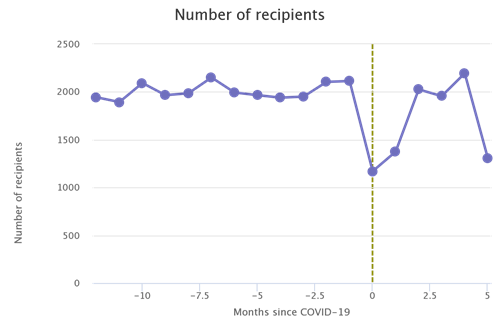
A closer look at kidney transplant numbers reveals that living donor kidney transplants (red line) declined 86% that month, dropping to just 73 living donor transplants from March 13 to April 12, in contrast with 526 a month before the emergency.
However, a turnaround occurred in the third month after the declaration (shown in the second month of both figures). Kidney transplants from brain-dead donors (DBDs) reverted to numbers seen before the pandemic, while kidney transplants from living donors and donations following circulatory death (DCDs) remained slightly below pre–COVID-19 numbers. (Note that the most recent analyses above may be incomplete because data are updated monthly.)
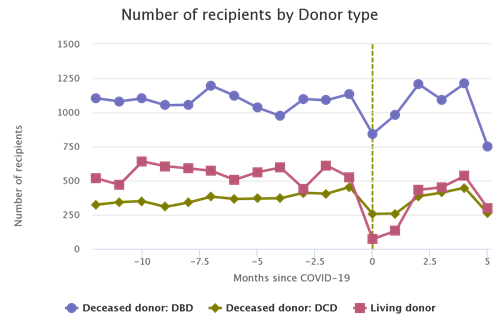
The number of donors decreased about 25% in the first two months of the pandemic in the United States and returned to pre-emergency levels the next month. I believe this demonstrates the laudable dedication of personnel in the national transplant system to giving the gift of life to those in need. SRTR continues to evaluate the effects of COVID-19 on the system and updates the application monthly.

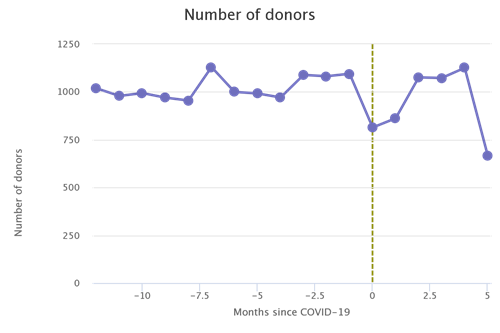
I hope my appreciation for the organ donation and transplantation field inspires action. The need for organ donation continues to be great, so please consider designating yourself as an organ, eye, and tissue donor through your state’s registry or at www.registerme.org. Our team extends our best to those working on the frontlines of the transplant system during COVID-19. Your work is vital to so many in need.
References
1. Organ Procurement and Transplantation Network. https://optn.transplant.hrsa.gov/data/view-data reports/national-data# (accessed September 18, 2020.)
__________________________________________________________________________________
Eric Weinhandl, PhD, MS, Senior Epidemiologist
September 1, 2020
Well, not quite tomorrow. Maybe a few years from now.
In the United States and around the world, peritoneal dialysis (PD) is an incident therapy. In other words, most PD prescriptions are written for patients who are initiating dialysis for the treatment of end-stage kidney disease (ESKD). There are both psychosocial and clinical reasons for this. For patients who are transitioning from a life with chronic kidney disease to a life with chronic dialysis, the possibility of continuing to live and dialyze at home can be very attractive. On the other hand, nephrologists may be interested in preserving both residual kidney function — which is strongly associated with improved survival in dialysis patients — and the arm vasculature that is needed for an arteriovenous fistula, should hemodialysis (HD) be prescribed in the future.
In fact, for many patients who select PD, HD is a part of the future. However, even if nephrologists and nurses know this, it can be difficult to counsel patients and families about the future. Is PD a therapy for a lifetime? Is PD a mere transitional therapy to a life with in-center HD? Is PD somewhere in the middle of those extremes?
New data published in Kidney Medicine provides some answers, as well as historical perspective on PD in the United States (US). In an analysis from the United States Renal Data System (USRDS), Sukul and colleagues evaluated rates of kidney transplant, transition to in-center HD (sometimes labeled as “technique failure”), and death in US patients who initiated PD within the first six months after the diagnosis of ESKD. Interestingly, the authors evaluated patients who were diagnosed with ESKD between 1996 and 2014, thus creating an opportunity to examine the evolution of event rates across calendar years.
Patients were followed from the first day of PD, which could have occurred as early as the very first day of chronic dialysis or as late as six months after an ESKD diagnosis, until the earliest of kidney transplant, transition to in-center HD, or death, with censoring for kidney function recovery and discontinuation of dialysis (an outcome that is a little murky, but occurs much less often than death due to withdrawal from dialysis). Follow-up was strictly limited to three years after the first day of PD — a tremendously important point of context. Patients were grouped into years of ESKD incidence: 1996-1999, 2000-2003, 2004-2007, 2008-2011, and 2012-2014. The authors compared the rates of each outcome among the groups, with adjustment for factors that are on form CMS-2728 (ie, the Medical Evidence Report) and the annual census of the PD program.
Let’s discuss some of the most interesting results:
The big picture is that today’s PD patients can be counseled with relative confidence that life with PD is not a mere transitional state. If one adds the rates of kidney transplant, transfer to in-center HD, and death among patients with newly diagnosed ESKD in 2014, the sum is nearly 40 events per 100 patient-years. Think about the reciprocal of that quantity: 2.5 patient-years per event. In other words, a patient who is newly prescribed PD can expect to spend about 30 months with the modality before a good (transplant), neutral (transfer to in-center HD), or bad (death) outcome occurs. Furthermore, if neither transplantation nor death occurs, then the likelihood of remaining on PD after three years is a little higher than the chance of seeing heads upon the flip of a fair coin. I would contend that an appropriate conclusion from all of this is that three to five years with PD is a very realistic outcome.
Of course, another conclusion is that hemodialysis is a possible destination along the journey of ESKD. For many patients, PD will not be a lifetime therapy. We must communicate honestly to patients and their families that modalities can and do change. From that perspective, it is important for researchers and policymakers to thoughtfully consider how to incorporate the transition from PD to in-center HD in quality measures. Some of these transitions are preventable and many are very disruptive, with extensive hospitalization due to intercurrent illness. However, transitions may also be what patients prefer. If we are truly committed to patient autonomy in selecting kidney replacement therapies, then we must respect that the goal rate of transition to in-center HD is not necessarily equal to zero events per 100 patient-years. How to operationalize this thought is a great challenge for a future that widely encourages home dialysis.
One of the unintended consequences that likely accompanies home dialysis evaluation is increasing PD selectivity — or home HD, for that matter. Plainly stated, selectivity for home dialysis is a dangerous enticement. One could argue that Sukul and colleagues have shown selecting healthier patients for PD is the most expedient way to lower death rates on PD. In the era of Advancing American Kidney Health (AAKH), we must resist this temptation, however difficult that may be for dialysis facilities that are so often graded according to relative clinical outcomes. If we cast wider nets for home dialysis, including for patients with substantial comorbidity and frailty, then we should expect that death rates on PD will increase and rates of kidney transplantation will decrease. For that matter, transition rates from PD to in-center HD may increase. Even the reported association of larger PD program sizes with lower transition rates to in-center HD is sensitive to selectivity. There is likely a technical component to this association, insofar as “practice makes perfect.” However, the largest PD programs — those that try to train all patients with newly diagnosed ESKD to perform home dialysis — are likely to exhibit relatively poor outcomes, because some of the underlying medical and social challenges that dialysis patients face are effectively transferred from the pool of in-center HD patients to the pool of PD patients.
To summarize:
We are making progress with PD, and we need to keep making progress, because longevity of home dialysis mathematically influences overall utilization of home dialysis. Nevertheless, I hope that we do not grow too beholden to hard measures like transition rates. The goal is to deliver high-quality, patient-centered dialysis — not necessarily one modality per lifetime.
__________________________________________________________________________________
Eric Weinhandl, PhD, MS, Senior Epidemiologist
July 27, 2020
Every summer, the Centers for Medicare and Medicaid Services (CMS) releases a proposed rule regarding the End-Stage Renal Disease (ESRD) Prospective Payment System (PPS) and Quality Incentive Program (QIP). Essentially, the proposed rule lists potential updates to Medicare policy—including reimbursement—pertaining to outpatient dialysis facilities, effective at the beginning of the next calendar year.
The most important news is that, like every year, anyone can participate in rulemaking.
Are you a nephrologist? A nurse? A social worker or dietitian? Are you a researcher? Are you a patient undergoing dialysis? Do you have a stake in the future of dialysis? If the answer to any of these questions is “yes,” you should consider offering comments to CMS.
The proposed rule is published in the Federal Register. On the linked page there is a large green button labeled “Submit a Formal Comment.” Click that button and write your comments. The submission deadline is September 4, 2020. I wrote a few comment letters in the past, so I have a few pieces of advice:
This year’s proposed rule tallies 77 pages in the Federal Register, a government publication that usually includes three columns per page. My goal is to highlight several important items in the proposed rule that should merit attention from anyone who cares about dialysis. I do not aim to share personal remarks about these items. (I’ll save my opinions for my comment letter.) I do hope that by distilling 77 pages into a set of questions, you might be able to more efficiently craft a comment letter that strikes the heart of the matter. So, without further delay:
Calcimimetics in the bundle
CMS proposes to add calcimimetics to the bundled payment for outpatient dialysis in 2021. In 2018-2020, calcimimetics—oral cinacalcet and intravenous etelcalcetide—were separately reimbursable via the Transitional Drug Add-on Payment Adjustment (TDAPA). TDAPA is actually intended to apply for two years, not three, so the inclusion of calcimimetics in the bundle is not a surprise.
The core question is this: what is an appropriate amount of money for CMS to pay for calcimimetics? It is a difficult question to answer because of two important developments during the TDAPA application: the arrival of generic cinacalcet and the introduction of oral etelcalcetide. The derivation of an appropriate amount is further complicated by CMS' goal to add a single amount per hemodialysis session, even though only 30% of hemodialysis patients use calcimimetics.
Let’s start with CMS’ math. The agency queried Medicare claims from outpatient dialysis facilities in 2018 and 2019. In so doing, CMS found that dialysis facilities dispensed or administered the following amounts to patients with Medicare Part B coverage:
CMS proposes to multiply each quantity by the respective average sales price (ASP) of each agent in the most recent quarter. In the Federal Register, that quarter is the second quarter of 2020. In the forthcoming final rule, CMS will likely use ASPs in the third or fourth quarter of 2020. Does this matter? Yes. Look at the trajectory of ASPs for cinacalcet and etelcalcetide since the first quarter of 2018:
In the proposed rule, CMS used ASPs of $0.231 per mg for cinacalcet and $22.00 per mg for etelcalcetide. Thus, CMS derived total calcimimetic expenditures in 2018-2019 that were equal to:
1,824,370,597 × $0.231 + 30,671,241 × $22.00
= $1,096,200,947
CMS also identified 90,014,098 hemodialysis-equivalent sessions, whereby one day of peritoneal dialysis is equal to three-sevenths of a hemodialysis session. Thus, the agency derived a bundled payment rate for calcimimetics equal to:
$1,096,200,947 / 90,014,098
= $12.18
The outlier policy shaved 1% off this amount, leading to the proposal of $12.06.
That is the algorithm. These are the questions to consider:
TPNIES Applicant #1: Theranova 400/500 dialyzers
Last year, CMS created the transitional add-on payment adjustment for new and innovative equipment and supplies (TPNIES). Essentially, TPNIES intends to add an amount to the bundled payment for outpatient dialysis to incentivize “new” (FDA marketing authorization after January 1, 2020) and “innovative” (more on that in a moment) dialysis-related supplies that are not capital-related assets. If approved under TPNIES, CMS would authorize for two years a per-treatment payment equal to 65% of the supply price determined by the local Medicare Administrative Contractor (MAC).
What is innovative? CMS defined it last year as a supply satisfying the “substantial clinical improvement” (SCI) criteria. Briefly, SCI implies that a supply “substantially improves, relative to renal dialysis services previously available, the diagnosis or treatment of Medicare beneficiaries.” There are several ways to prove SCI:
CMS indicated that evidence might be derived from randomized and non-randomized studies. The first applicant for TPNIES is Baxter’s series of Theranova 400 and 500 dialyzers; the series numbers indicate differences in surface area. These are medium cut off dialyzers.
CMS evaluated evidence and concluded that there is “insufficient evidence at this time to demonstrate a clear clinical benefit for Medicare dialysis patients.” The agency solicits your opinion about whether Theranova dialyzers satisfy the SCI criteria.
TPNIES Applicant #2: Tablo cartridge
The second applicant for TNPIES is Outset Medical’s Tablo cartridge for the Tablo Hemodialysis system. The Tablo Hemodialysis system is a new hemodialysis platform, which can be used in the facility setting and was recently cleared by the FDA for use in the home setting. The cartridge is a single-use, disposable arterial and venous bloodline set. More information can be found in FDA documents and on the KidneyViews blog.
CMS evaluated evidence and concluded the following: “The cartridge is a promising concept to encourage home hemodialysis, but again, the evaluation of this technology is complicated by the need to also peripherally assess the [Tablo Hemodialysis] system… Within the larger policy context of FDA approval and the fact that TPNIES does not currently cover capital-related assets, the CMS TPNIES Work Group believes there are some irregularities and misalignments in the current application, and is concerned that the standalone cartridge cannot be evaluated for meeting the criteria for SCI.” The agency solicits your opinion about whether the Tablo cartridge alone satisfies the SCI criteria.
TPNIES: a proposed expansion into home dialysis equipment
This is an interesting proposal. As I mentioned earlier, the TPNIES program currently in effect excludes capital-related assets. The definition of such an asset is actually a part of this year’s proposal; if finalized, the definition would be “an asset that an ESRD facility has an economic interest in through ownership (regardless of the manner in which it was acquired) and is subject to depreciation.” CMS notes that equipment obtained by the ESRD facility through operating leases are not considered capital-related assets.
What is new this year is a proposed expansion of TPNIES into capital-related assets that are home dialysis machines—either for home hemodialysis or peritoneal dialysis—when used in the home for a single patient. CMS notes that this proposal is motivated by the broad goals of the Executive Order on Advancing American Kidney Health. That order imagines that 80% of incident ESKD patients in 2025 would receive a kidney transplant or dialyze in the home.
The broad outlines of the proposal are the following:
Let’s make that last point concrete. Imagine that a new hemodialysis machine has a price of $20,000. Of course, 65% of $20,000 is $13,000. Five-year straight-line depreciation results in an annual cost of $13,000 divided by five, or $2,600. If the machine is used four times per week, then there are 208 treatments per year, so the TNPIES payment is $2,600 divided by 208, or $12.50 per treatment.
This proposal may be an effective way to motivate increased utilization of home dialysis modalities. CMS seeks comments about all aspects of its proposal, including SCI criteria and payment methodology. I encourage commenters to consider how SCI criteria can be applied to home dialysis machines, especially insofar as machines and prescriptions together influence the outcome of dialysis. Ask yourself this: when can a machine, by its very nature, satisfy SCI criteria? I also encourage commenters to consider whether payment methodology details are appropriate, especially in the case of home hemodialysis machines that might be used between two and six times per week.
Many in the kidney community, including myself, have advocated for greater utilization of home dialysis. Can this proposal—or a modification of it—be a meaningful part of incentivizing greater utilization? That is the question before all of us.
AKI reimbursement
CMS proposes once again to set payment for hemodialysis sessions in acute kidney injury (AKI) patients equal to payment for hemodialysis sessions in ESKD patients. Thus, reimbursement would increase to $255.59 in 2021, but would presumably be subject to further revision in the final rule, owing to specific ASPs for calcimimetics. Although CMS did not ask for comments about this approach, I would encourage commenters to discuss whether continued alignment between dialysis for AKI and dialysis for ESKD is appropriate.
CMS proposed several other items, including changes to outlier payments, low-volume payment adjustments, wage indices, and the specifications of several QIP measures, but this blog entry is already long enough. I think that calcimimetics and the evolving TPNIES program are the stars of this year’s proposed rule, so focusing comments in those domains is a good idea, especially if your time is limited during July and August. Good luck writing!
__________________________________________________________________________________
Eric Weinhandl, PhD, MS, Senior Epidemiologist
July 1, 2020
This entry is the first in a new blog published by the Chronic Disease Research Group (CDRG) in Minneapolis, Minnesota. The goal of this blog is to provide visibility into medical research and health care policy news that intersect with the diverse areas of expertise among CDRG investigators.
As the public may know, CDRG has long been involved in nephrology research, including operating the United States Renal Data System (USRDS) Coordinating Center. I myself returned to CDRG after spending the past half-decade at NxStage Medical and Fresenius Medical Care North America. I am always interested in the latest from the domain of observational (ie, non-randomized) research about chronic dialysis. I would like to discuss a fantastic study of dialysis population data from Europe.1
The title immediately reveals a twist on an old topic. About 10 years ago, Robert Foley and colleagues published a study in the New England Journal of Medicine about the long interdialytic gap, a roughly 72-hour interval between consecutive hemodialysis sessions on Friday and Monday or Saturday and Tuesday.2 In that study, which included over 32,000 patients, the mortality rate on the day after the long interval was 23% higher than on other days, and the cardiovascular hospitalization rate was 124% higher. These findings were later corroborated by patterns of cardiovascular death in the Dialysis Outcomes and Practice Patterns Study (DOPPS) and the Australian and New Zealand Dialysis and Transplant Registry (ANZDATA).3, 4
One might hypothesize that if a 72-hour gap between consecutive hemodialysis sessions is deleterious for volume control and electrolyte (eg, potassium) balance, then an even longer gap—a product of missing the first hemodialysis treatment of the week—is even worse. That is the question that the new study by Fotheringham and colleagues aims to answer. The irony of the question is that the study at hand reflects the experience of patients in Europe, whereas the problem of missed hemodialysis sessions is prominent in the United States. In a recent study from DOPPS investigators, the prevalence of at least one missed hemodialysis session per month was 7.9% in the United States—far above the corresponding prevalence estimates of 0.6% in a set of five large European countries and Japan.5
The authors of the study used data from the Analyzing Data, Recognizing Excellence, and Optimizing Outcomes (ARO) cohort study of patients who initiated hemodialysis in one of 312 Fresenius Medical Care dialysis facilities across 15 countries in Europe. Patients initiated dialysis between 2007 and 2009—admittedly, quite a while ago—and were followed through 2014. The study was limited to in-facility hemodialysis patients with thrice-weekly schedules that were identified as Monday-Wednesday-Friday (MWF) or Tuesday-Thursday-Saturday (TTS).
The study included almost 9,400 patients and approximately 3.8 million scheduled treatment days. Despite the volume of data, the design of the study was relatively simple. The design is summarized by Figure 1 in the article:
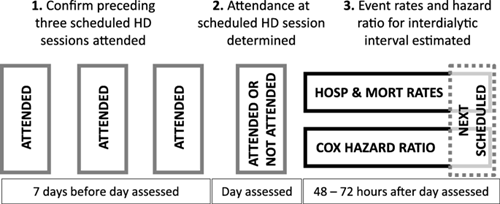
The middle of the above figure is the “anchor.” In other words, each observation in the study was a scheduled hemodialysis session. That session may or may not have been attended. Only scheduled sessions that were preceded by perfect adherence (and the absence of hospitalization) during the preceding 7-day interval were retained for analysis. Missed treatments on a scheduled day did not reflect hospitalization or death on that day, as such instances were excluded. After each scheduled session, patients were followed for 48 to 72 hours to assess the incidence of death and hospitalization. In other words, the authors took the phenotype of a dialysis patient with stability in the outpatient setting, tested whether a “surprising” missed treatment was associated with poor outcomes, and assessed whether the day of the dialytic week influenced the strength of that association.
It turns out that nothing is new under the sun, with respect to predictors of missed treatments. In particular, the mean age of patients who missed treatments during the first four months of follow-up was roughly three years younger than the mean age of patients with perfect adherence. Predictably, comorbidity was associated with higher likelihood of missed treatments, which may just be a manifestation of older age.
So, what do the models of death and hospitalization tell us? Well, the authors present a lot of figures, but let’s stick with two: Figure 3B, which shows adjusted hazard ratios of death, by day of week and attendance status; and Figure 4B, which shows adjusted hazard ratios of hospitalization, by day of week and attendance status. Hazard ratios of death are shown below:
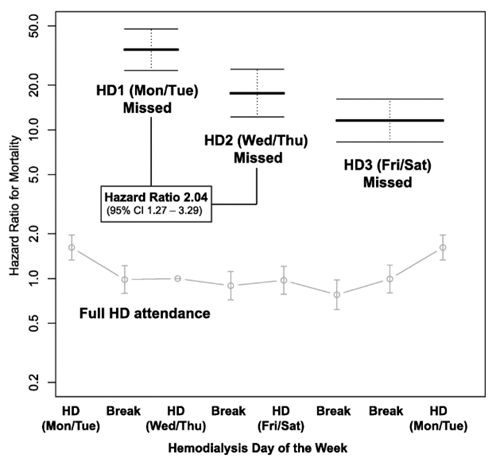
Notice that the vertical axis is a logarithmic scale. In other words, patients who missed treatments had 10 to 50 times the mortality risk of patients with perfect adherence. Patients who missed the first hemodialysis session of the week were at the highest risk, whereas one might say that patients who missed the last hemodialysis session of the week were at a “less profoundly” elevated risk. It should be noted that in patients with perfect adherence, risk of death was highest after the first day of the hemodialysis week. That’s an interesting observation, as these patients attended not only all three sessions during the previous 7-day interval, but also the session on the scheduled day at hand. One cannot help but wonder if aggressive ultrafiltration is the culprit, although that’s a question for another study.
Hazard ratios of hospitalization are shown below:
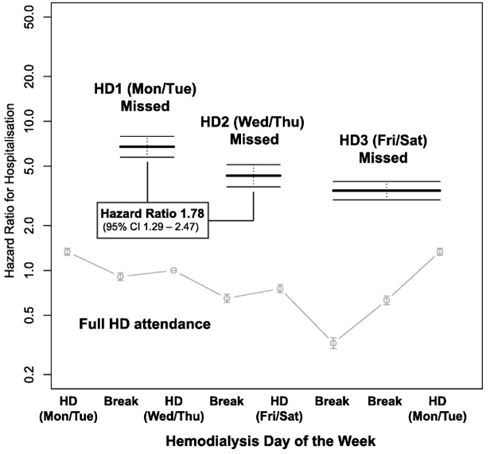
The pattern is qualitatively similar. Patients who missed the first hemodialysis session of the week were at the very highest risk of hospitalization, whereas patients who missed the last hemodialysis session of the week were at a “less profoundly” elevated risk.
This is an observational study, and like all such studies, it is possible that confounding factors are chiefly responsible for data patterns. The authors suggest that “acute illness which both prevents attendance for scheduled dialysis and leads to hospital admission or death” could be a culprit. It’s important to acknowledge this possibility.
However, the reality of the accumulated literature is this:
The proximal challenge facing dialysis in the United States is addressing missed treatments, especially on the first day of the dialysis week. Providing resources to ensure transportation to and from the dialysis facility, and providing patients with treatment reminders via text message are two of many options that should be embraced.8 Interventions that lower the frequency of missed treatments are likely to confer positive effects on the risk of fluid- and electrolyte-mediated cardiac events. Considering the strength of associations in this study, one might argue that missed treatments on the first day of the dialysis week ought to be “never events” that are assessed in quality measurement systems.
The broader question is what to do about all the interdialytic gaps. Wider utilization of peritoneal dialysis (PD) in incident end stage kidney disease patients would be an excellent start, as the continuous nature of PD eliminates the concept of the interdialytic gap. Frequent home hemodialysis is another solution, albeit far from a universal one. What can be done for patients who cannot or will not dialyze at home? As a population-wide intervention, frequent in-facility hemodialysis tends to exhibit low cost-effectiveness, as demonstrated in international literature.9 However, a one-size-fits-all solution is the problem. As Hostetter recently wrote, “[D]ialysis care must be one of the least ‘personalized’ sectors of current health care.” 10 We need to continue designing systems that facilitate adaptations of in-facility hemodialysis for risk-stratified groups, such as:
The first category of patients can continue to dialyze three times per week, but the second category of patients will require every-other-day dialysis, thereby creating demand for Sunday shifts in dialysis facilities or community houses for “drop-in” self-care hemodialysis. The last category of patients is the most complex to manage, as they will require four to six treatments per week. Can all these patients be treated at home? This is unlikely. Could these patients mix in-facility and home treatments? With appropriate financial resources, it is possible. What seems clear to me is that business as usual, with almost universal application of thrice-weekly hemodialysis, will continue to produce sawtooth patterns in daily rates of death and hospitalization.
References
Contact Us
Chronic Disease Research Group
Hennepin Healthcare Research Institute
701 Park Ave.
Suite S2.100
Minneapolis, MN 55415
Email: cdrg@cdrg.org
Tel: 612-873-6200
Mon-Fri: 8:00 AM - 4:30 PM CT